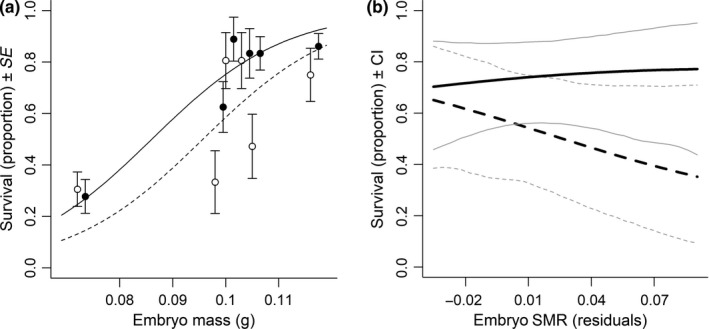
Figure 3.

Relationships for the wild salmon juveniles of the Imsa population between (a) survival and family‐level embryo mass at high (solid, filled) and low (dotted, open) food availability plotted together with mean ± SE values for each family, and (b) survival ± CI (gray) and family‐level embryo SMR at high (solid) and low (dotted) food availability after correcting for survival effects of family‐level embryo mass. Estimated survival effects of embryo mass are centered and plotted on mean values of the raw data. All relationships are back‐transformed estimates from the best GLMM for the treatment where wild salmon were in sympatry with hybrids with farmed father. The pattern was consistent across treatments (wild salmon in allopatry and in sympatry with both types of hybrids, shown in Table 1)
