Figure 3.

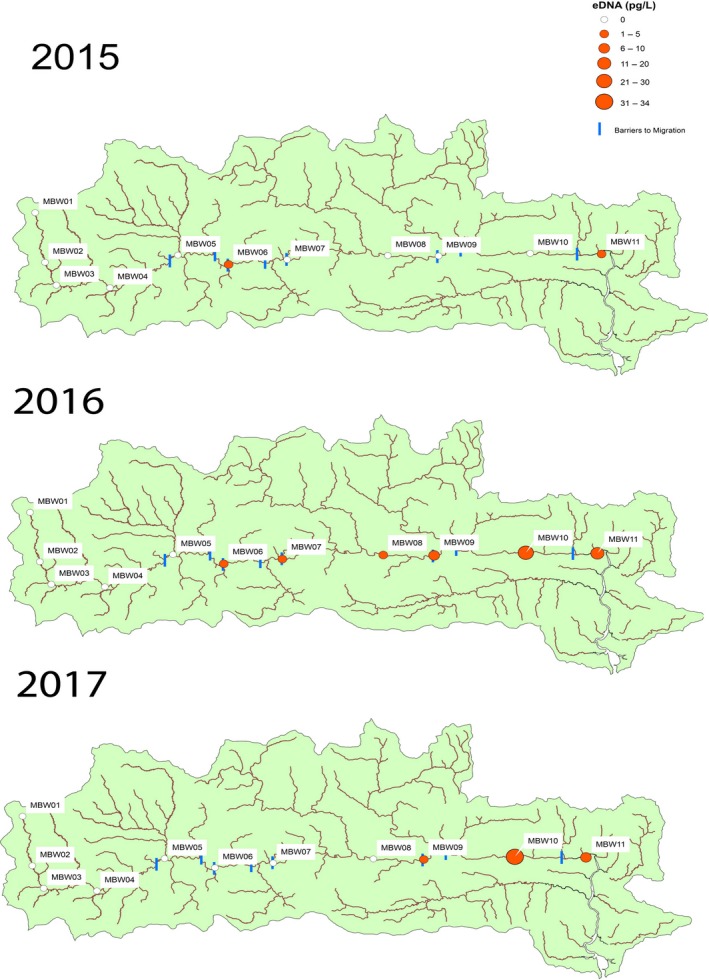
Total eDNA (pg/L) collected at each sampling site within the Munster Blackwater (MBW) catchment. Combined total amount of eDNA collected on each sampling occasion from each year, respectively, 2015–2017

Total eDNA (pg/L) collected at each sampling site within the Munster Blackwater (MBW) catchment. Combined total amount of eDNA collected on each sampling occasion from each year, respectively, 2015–2017