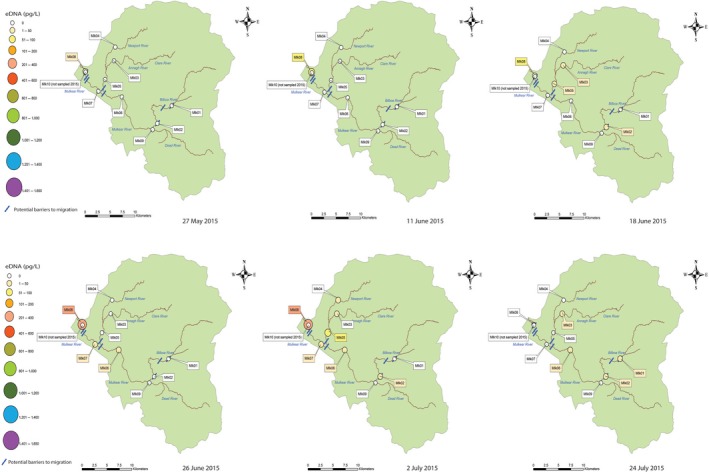
Figure 7.

Snapshot sampling in the Mulkear in 2015 reveals temporal variation in eDNA concentrations taken over six separate sampling dates. Sampling on each date provides valuable information about dispersal throughout the catchment and habitat use over time
