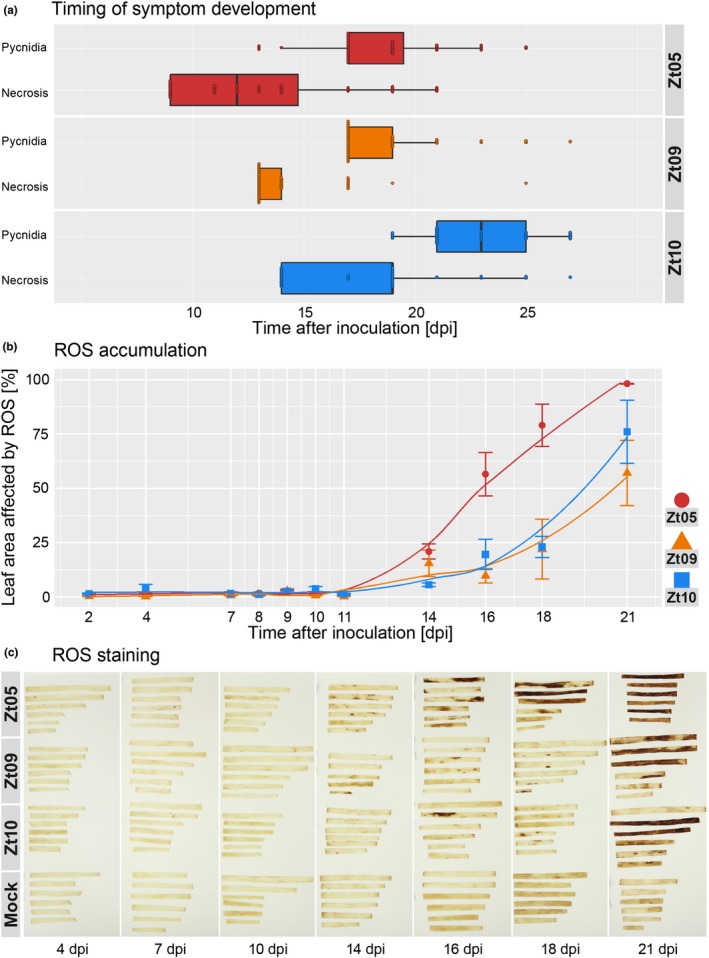
Figure 2.

Timing of disease symptom development and H2O2 accumulation varies between wheat leaves infected with different Zymoseptoria tritici isolates. (a) Temporal disease progression for infections with Zt05, Zt09, and Zt10 was measured by manual screening for the first occurrence of necrotic spots and pycnidia. For each isolate, 40 leaves of the wheat cultivar Obelisk were inoculated and tested. No disease developed on seven of the leaves inoculated with Zt10. (b) Reactive oxygen accumulation in infected leaves was visualized by staining with 3,3′‐diaminobenzidine and quantified by analysis of six scanned leaf images per isolate and time point. Mean values of percentage leaf area affected by ROS are plotted. Error bars indicate standard errors of the mean. (c) Dark red‐brown precipitate indicates H2O2 accumulation and appeared first in leaves infected with Zt05 in leaf areas beginning to undergo necrosis
