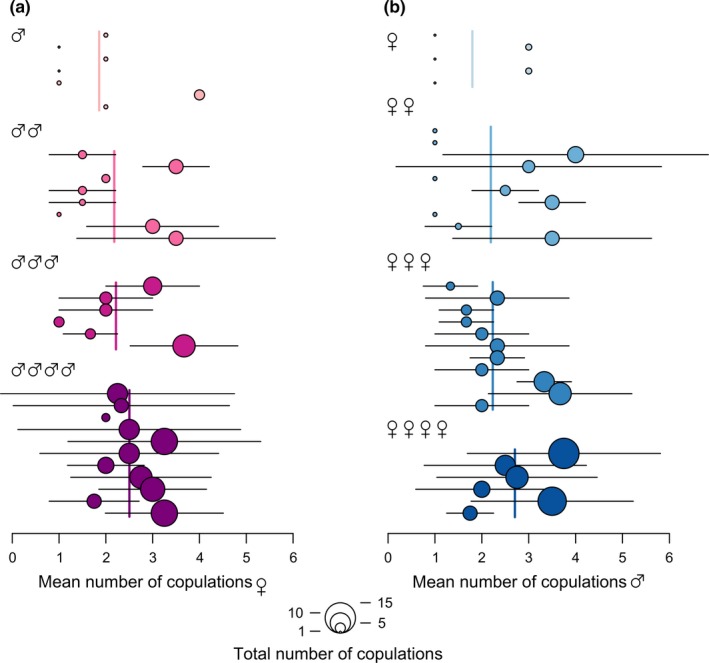
Figure 2.

Forest plot of the mean number of copulations of (a) females and (b) males of Pholidoptera griseoaptera in established random mating groups (four females and four males in each). Circles represent the mean number of copulations (±SD as horizontal segments) of each individual per number of its mates and have areas proportional to the total number of copulations executed by this individual. Individuals are ordered according to the number of their mates (ascending from single mate to four mates)
