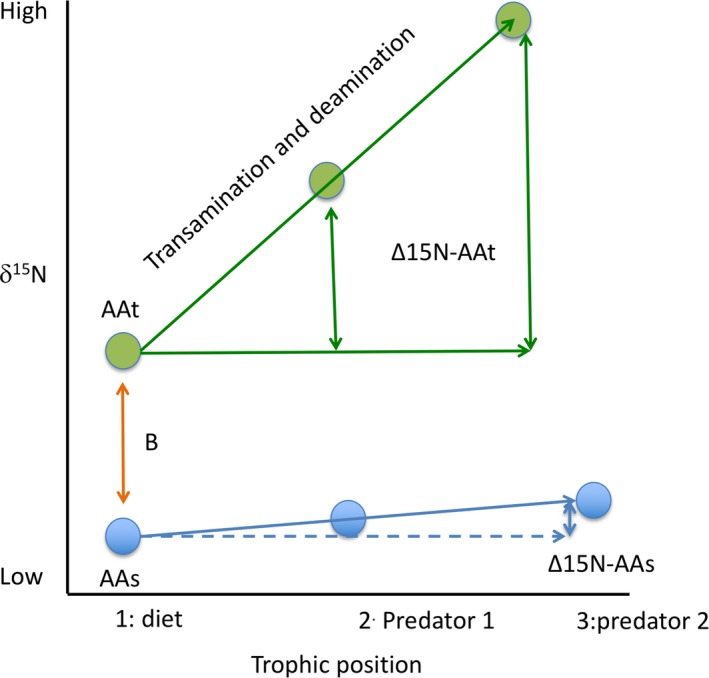
Figure 7.

A schematic diagram of fractionation in individual amino acids nitrogen isotope value with trophic transfer. Trophic amino acids (AAt), with higher δ15N (B) than source amino acids (AAs), show large fractionation with each trophic transfer. On the contrary, source amino acids (AAs) show little to no fractionation with trophic transfer (adapted from McMahon et al., 2015)
