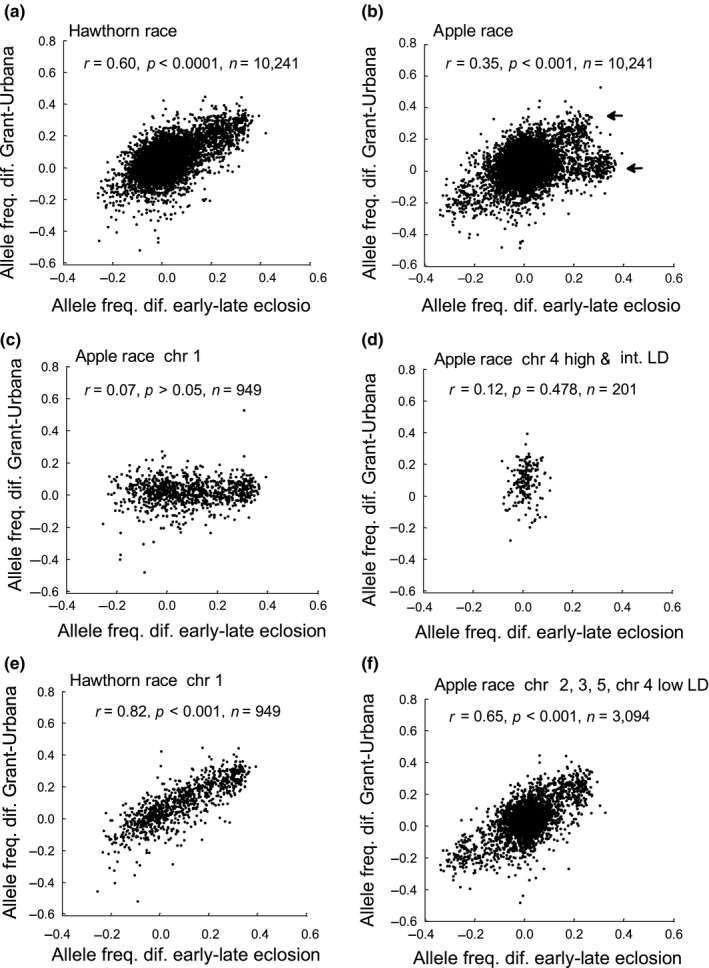
Figure 5.

Relationships of the genetic responses of SNPs in the eclosion time GWAS (differences in allele frequencies for SNPs between early‐ and late‐eclosing quantiles of flies) vs. geographic divergence (differences in allele frequencies for SNPs between Grant and Urbana sites) for (a) all SNPs in the hawthorn race; (b) all SNPs in the apple race; (c) chromosome 1 SNPs in the apple race; (d) the high and intermediate classes of SNPs on chromosome 4 in the apple race; (e) chromosome 1 SNPs in the hawthorn race; and (f) chromosomes 2, 3, and 5, and the low LD class of loci on chromosome 4 in the apple race; n = number of SNPs in comparison. Arrows in panel b designate the dichotomous patterns of geographic variation displayed by the apple race. The lower arrow represents SNPs showing limited genetic association between eclosion time and geographic variation, while the upper arrow denotes SNPs displaying a more marked relationship
