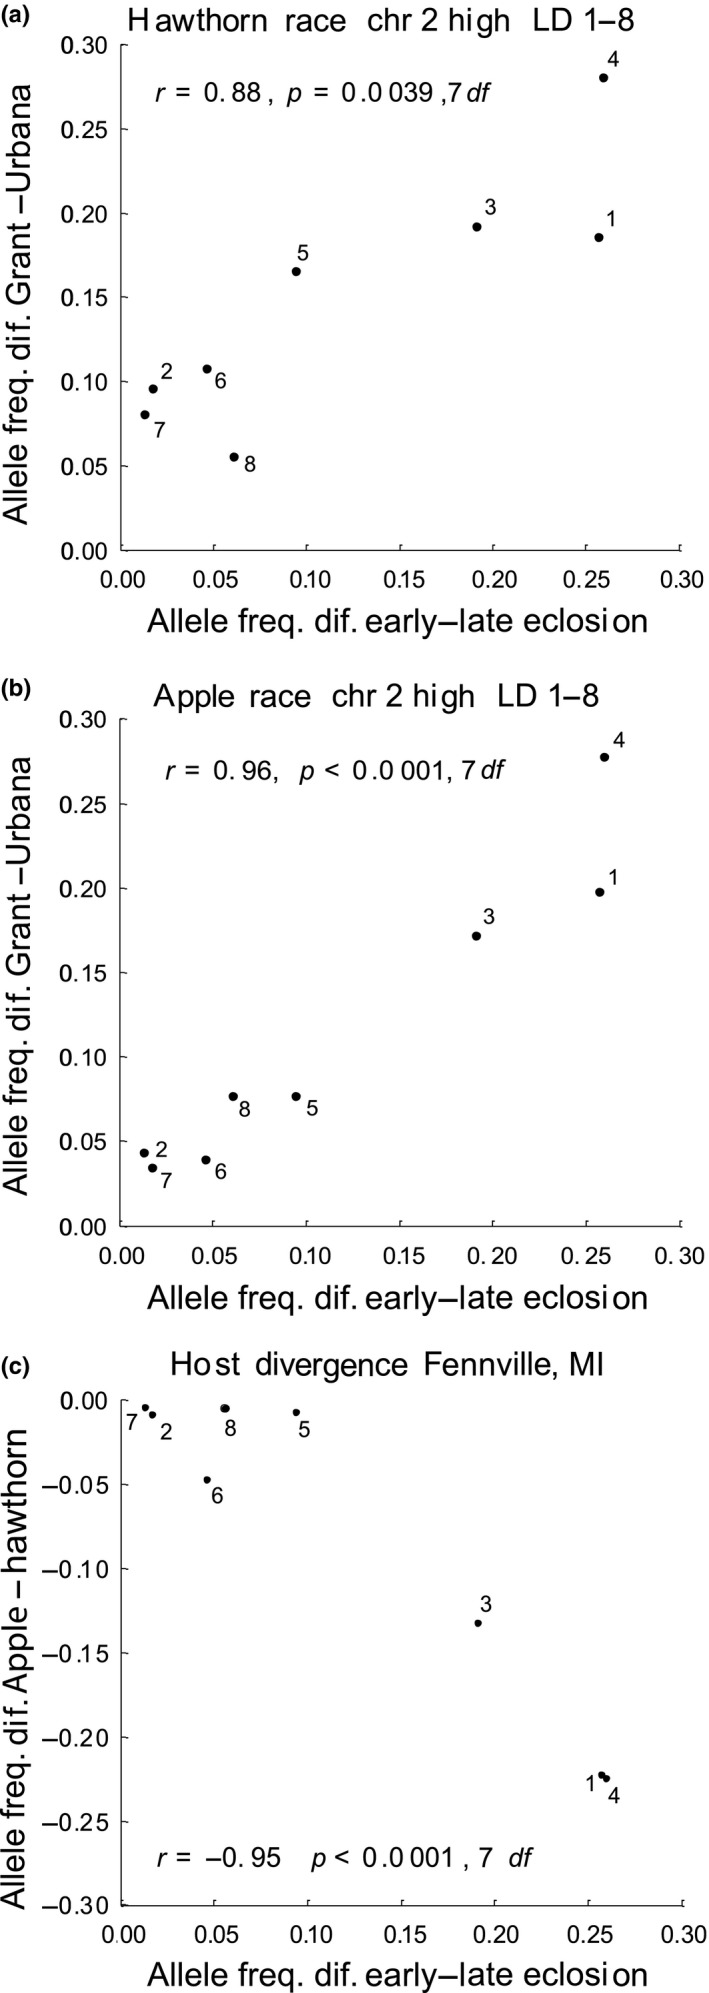
Figure 6.

Relationships of the mean genetic responses of SNPs belonging to the eight different high LD groups on chromosome 2 in the eclosion time GWAS (i.e., their average allele frequency differences between early‐ and late‐eclosing quantiles of flies) vs. (a) their mean frequency differences in the hawthorn race between Grant and Urbana; (b) their mean frequency differences in the apple race between Grant and Urbana; and (c) their mean frequency differences between the apple and hawthorn races at Fennville, MI. Numbers (1–8) in figures designate the eight different groups of high LD loci, presumably representing eight different relatively small‐sized inversions residing on chromosome 2
