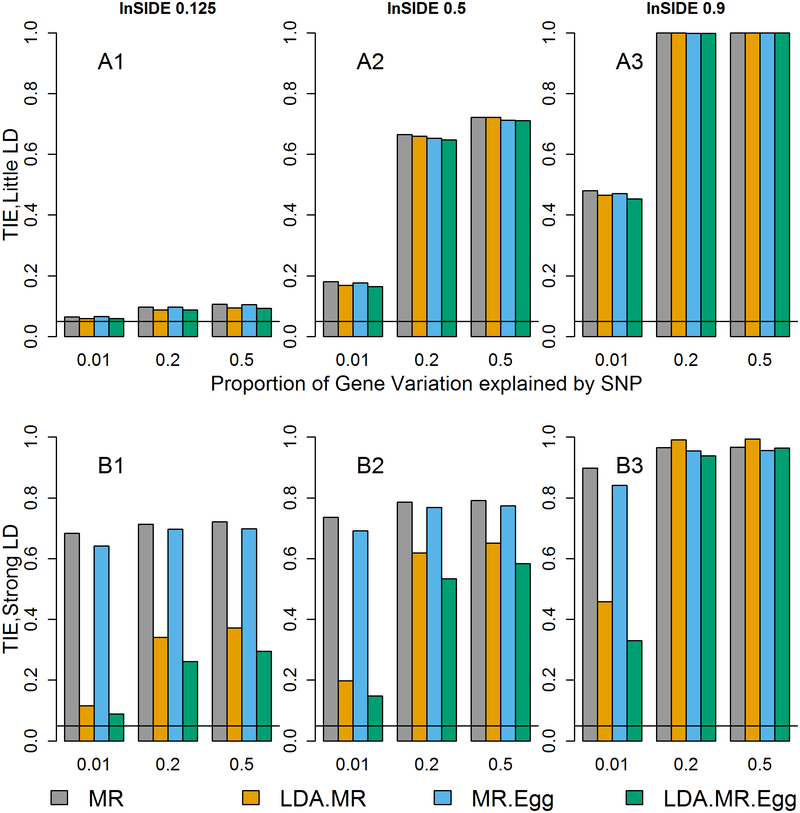
Figure 3: Type I error when J=50, InSIDE condition violated, and there is directional pleiotropy.
Each bar represents results over 5×10⁴ simulations. Evaluated at α = 0.05. First panel represent when low LD (plots with A). Second panel represents when strong LD (plots with B). From left to right correspond to: correlation between θj and βE,j is 0.125, 0.5, or 0.9.

