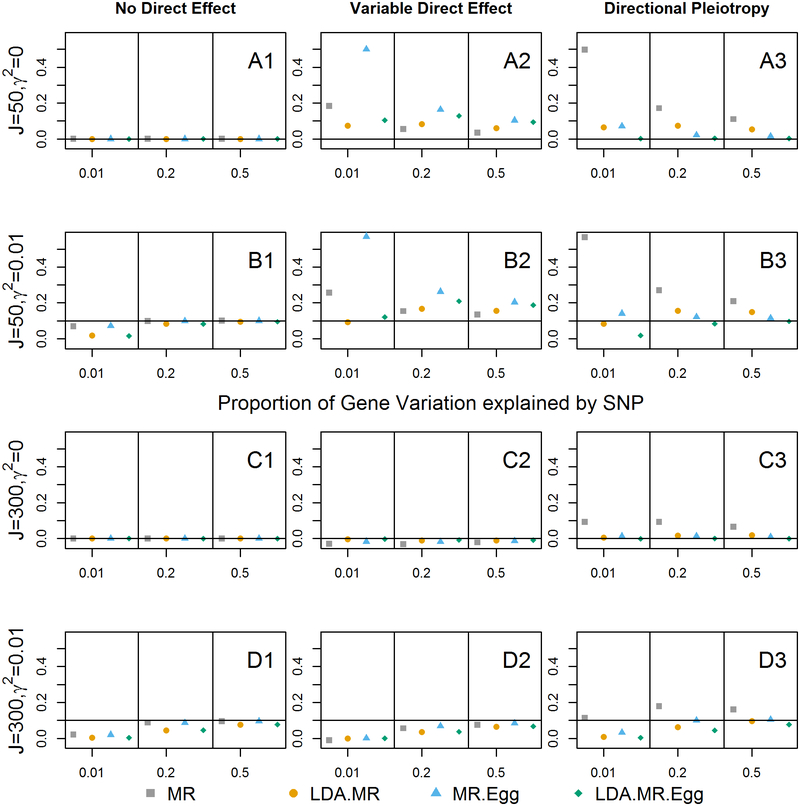
Figure 4: Bias when strong LD for J=50, 300.
Bias plots for when there is strong LD in the SNP set. First row corresponds to J=50, γ = 0 (plots with A). Second panel (plots with B) when J = 50 and γ2 = 0.01. Third panel (plots with C) when J = 300 and γ = 0. Final panel (plots with D) J = 300 and γ2 = 0.01. From left to right: no direct effect, variable direct effects with mean 0 across SNPs, and directional pleiotropy. When there is a direct effect, the SNPs explain 1% of the variation in the outcome ().

