
Extended Data Figure 7. The proportion of mutational signatures from Alexandrov et al.43 estimated in PIN101-PIN104.
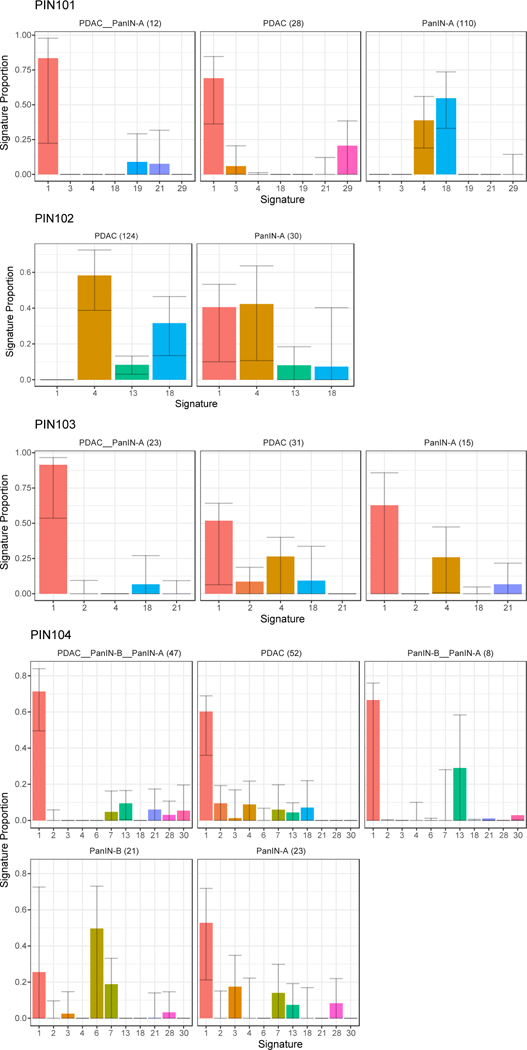
Signatures are shown on the x-axis, with the proportion of each signature shown on the y-axis. Each bar is colored by signature identity. The text on the top of each panel denotes the corresponding phylogenetic branch and the number of mutations acquired along it in parentheses. Error bars depict 90% confidence intervals in the signature proportion estimated by 100 iterations of bootstrap resampling.