
Extended Data Figure 4. Phylogenetics of PanINs and the matched primary tumor for patients PIN101, PIN103, PIN104, and PIN108.
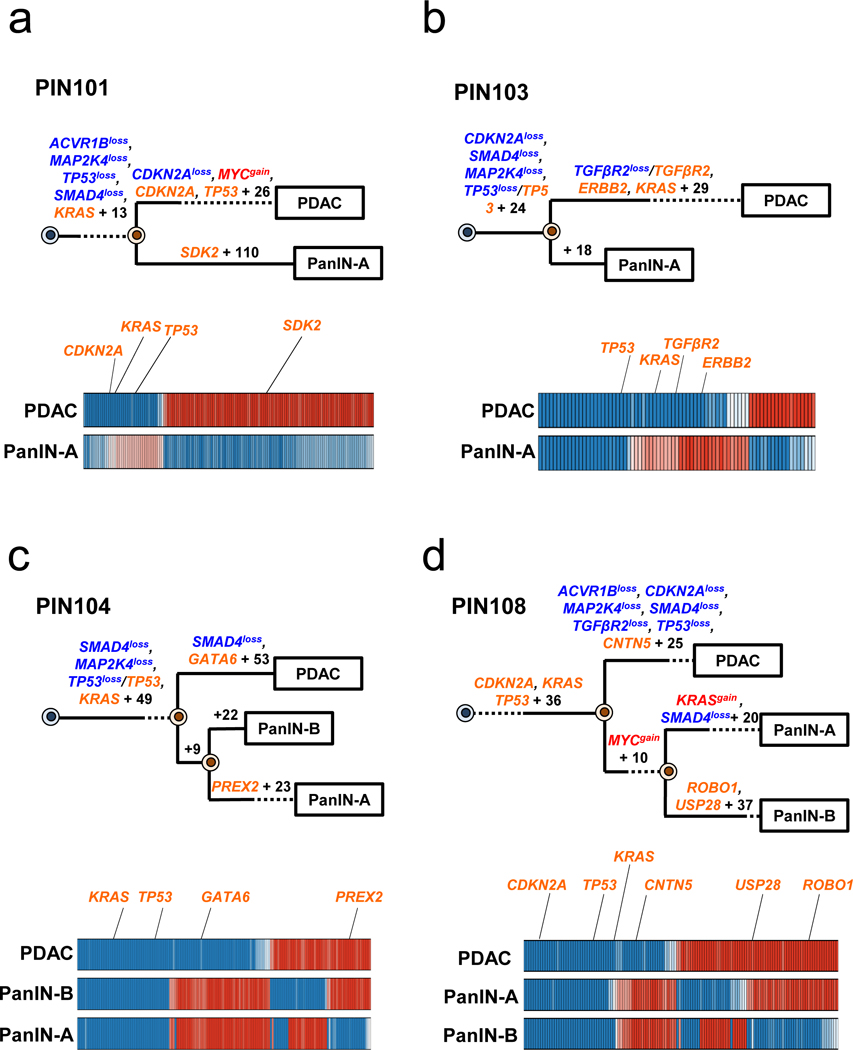
See Supplementary Table 1 for sample identities. The primary tumor is labeled “PDAC” while the PanIN is labeled by a letter. Gene names in orange text are SNVs/INDELs, in blue are copy-number losses, and in red are copy-number gains affecting putative driver genes. The sequencing data for each driver gene variant was manually reviewed to verify phylogenetic position. For each phylogenetic tree, the numbers of acquired mutations are in black font. The branch lengths are proportional to the number of SNVs/INDELs. The dashed lines indicate branches that have been extended to accommodate gene annotation and variant numbers. For the Bayesian heatmaps, samples are indicated on each row while variants are represented by each column. The color of each tile indicates the probability that the variant is present or absent in the corresponding sample. Dark blue indicates a variant with a >99.9% probability of being present, while dark red indicates a variant with a >99.9% probability of being absent. Light blue and red tiles indicate lower probabilities, and white tiles indicate approximately a 50% probability. a. PIN101. In manual review of the sequencing data, a read supporting the presence of the KRAS p.G12D variant was detected in both the PDAC and PanIN-A samples and was thus moved to the trunk of the phylogeny despite the overall low coverage of KRAS in PanIN-A. b. PIN103. c. PIN104. The node leading from the first MRCA to the second MRCA has a confidence value of >99%. d. PIN108. The node leading from the first MRCA to the second MRCA has a confidence value of >99%.