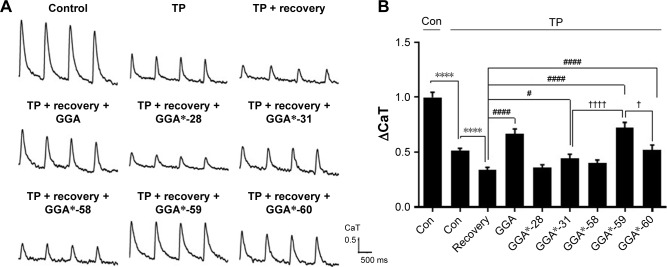
Figure 6.
GGA and GGA*-31, -59, and -60 accelerate restoration of CaT loss in HL-1 atrial cardiomyocytes after 24 hours posttreatment, compared to the nontreated cardiomyocytes.
Notes: (A) CaT of Control, TP, TP with 24 hours recovery and TP with 24 hours recovery in combination with posttreatment with 10 µM GGA or GGA-derivatives. (B) Quantified data revealing that GGA and GGA*-31, -59, and -60 accelerate restoration of CaT loss in HL-1 atrial cardiomyocytes after 24 hours posttreatment. **** is P<0.0001 compared to control cardiomyocytes, # is P<0.05; #### is P<0.0001 compared to tachypaced cardiomyocytes that recovered for 24 hours and † is P<0.05 and †††† is P<0.0001 compared to GGA*-59. The first control is a normal-paced control, treated with DMSO, indicated by the line above it with ‘Con’. The second control is a tachypaced control, treated with DMSO, indicated by the line above the bars with ‘TP’.
Abbreviations: CaT, calcium transient; Con, control; GGA, geranylgeranylacetone; TP, tachypacing.

