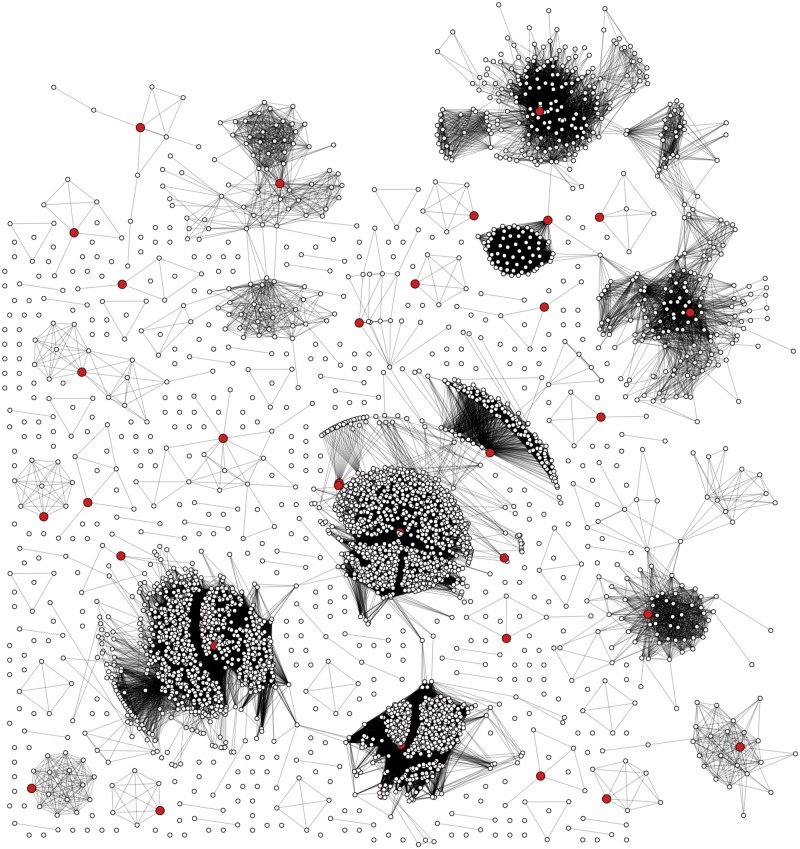
Figure 1.
Network diagram representing the clustering of HIV-1 near full-length sequences into communities of genetically similar genomes. Each point (node) represents an HIV-1 genome sequence, and each connection (edge) indicates that the respective nodes have a pairwise k-mer distance below the threshold. Larger (red) nodes represent sequences with the maximum degree-size centrality in their respective network communities; these sequences were in a MSA to generate a draft consensus genome sequence.

