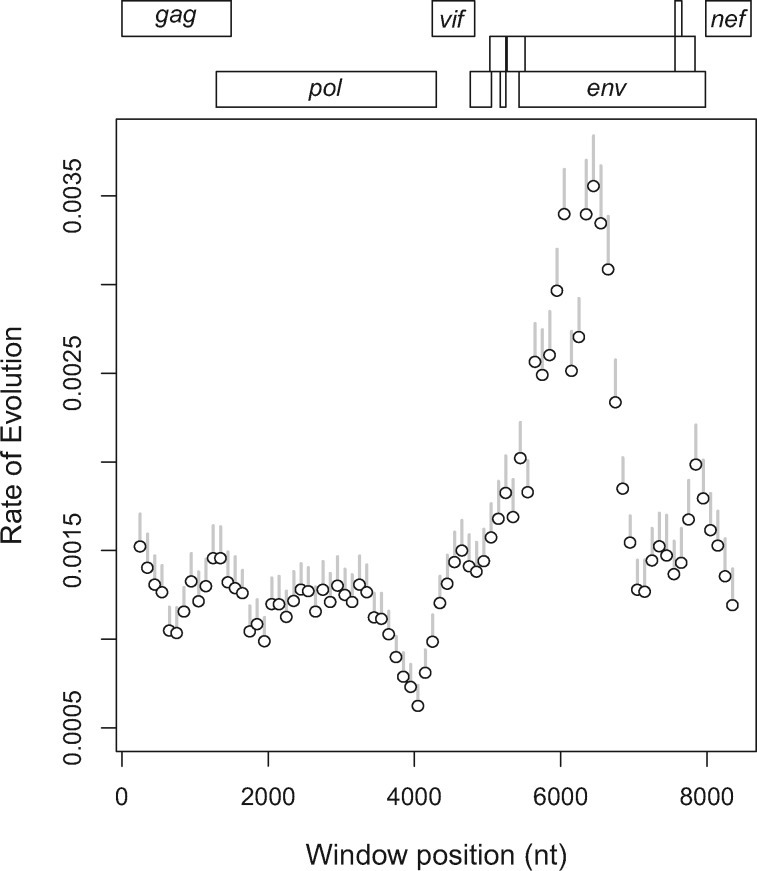
Figure 3.
HIV-1/M substitution rate estimates based on LSD. The y-axis represents rates of substitution for sequences in each window. The x-axis represents the genomic coordinates with each position corresponding to a gene region on the HIV-1 genome map at the top. Each point represents data for a sliding window of 500 nt per sequence. The gray lines represent the 95% CI for each rate estimate.

