Figure 3.

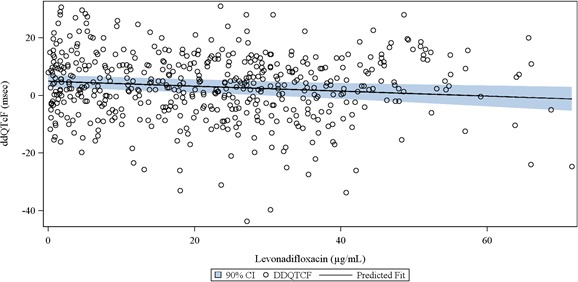
The plasma levonadifloxacin concentration–ddQTcF relationship. The linear mixed‐effects model showed a modest negative gradient (black fit line). The confidence band (blue shading) remained <10 milliseconds throughout.

The plasma levonadifloxacin concentration–ddQTcF relationship. The linear mixed‐effects model showed a modest negative gradient (black fit line). The confidence band (blue shading) remained <10 milliseconds throughout.