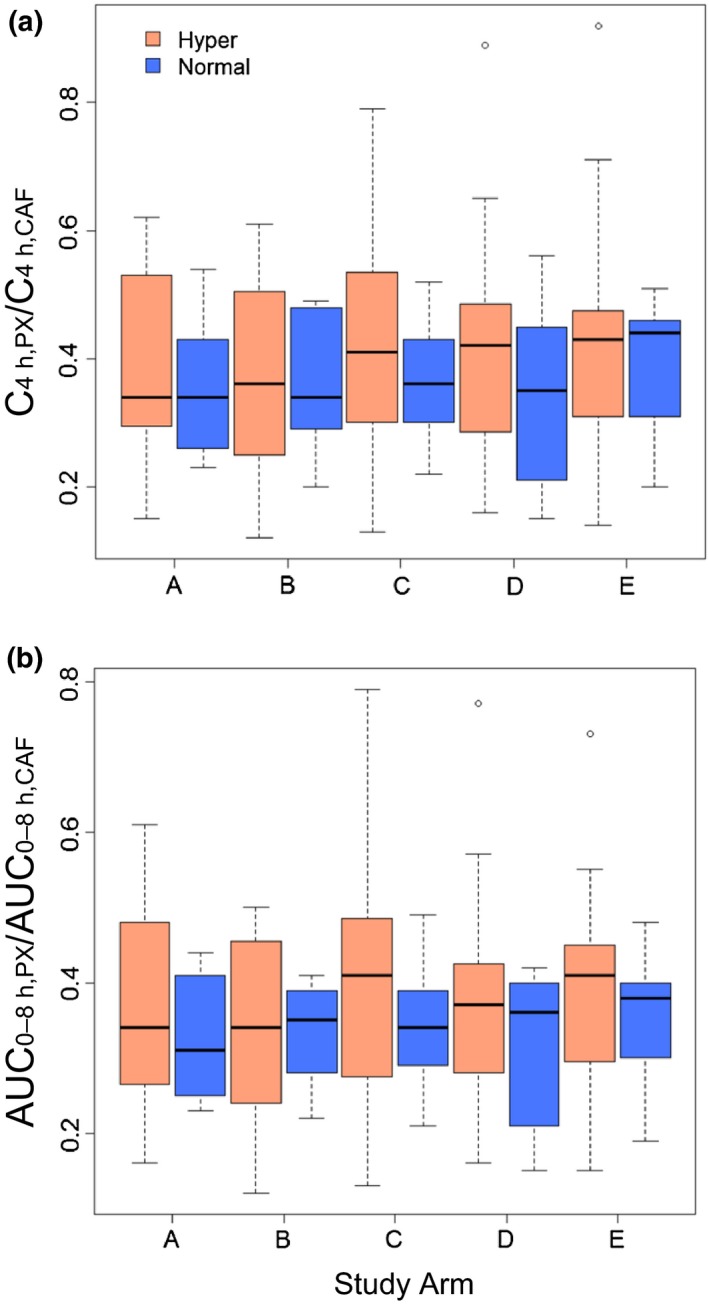
Figure 3.

Box‐and‐whisker plots of C4 h, PX/C4 h, CAF (a) and AUC 0‐8 h, PX/AUC 0‐8 h, CAF (b) ratios for each study arm among CYP1A2 hyperinducers (Hyper) and normal metabolizers (Normal). Arm A, hot coffee consumed over 20 minutes; arm B, cold coffee consumed over 2 minutes; arm C, cold coffee consumed over 20 minutes; arm D, energy drink consumed over 2 minutes; and arm E, energy drink consumed over 20 minutes. Lines inside the boxes denote medians, ends of boxes denote 25th and 75th percentiles, whiskers denote 1.5 times the interquartile distance, and circles denote outliers. No differences were detected within each treatment arm (P > 0.05; Wilcoxon‐Mann‐Whitney U‐test).
