Fig. 4.
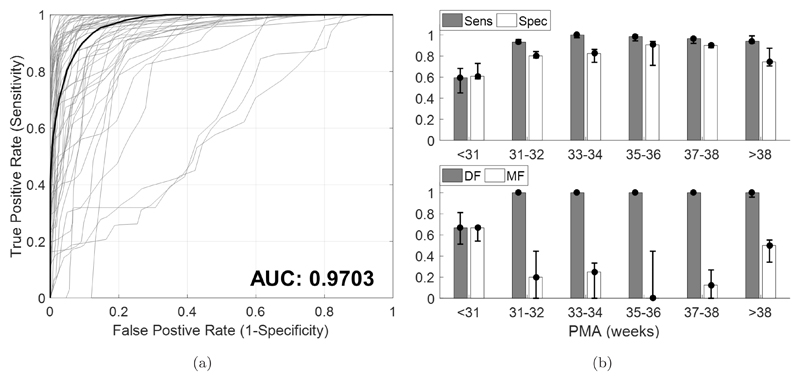
Assessing the performance of CLASS on a test set of 55 recordings aged 27–42 weeks PMA. (a) ROC of CLASS performance by varying the detection threshold while keeping all other optimized parameters constant. ROC curves for each recording in the test set (in gray) are shown, and resulting median ROC curve (in black). The AUC of the median ROC curve is also presented. (b) CLASS performance with respect to PMA denoting Sensitivity (Sens), Specificity (Spec), DF and MF. DF and MF denote Detection Factor and Misclassification Factor measures, respectively. DF measures the proportion of visually labeled QS periods correctly detected by CLASS, while MF measures the proportion of CLASS-detected periods that do not correspond to the visual QS periods (i.e. are misclassifications). Error bars denote the medians and IQRs.

