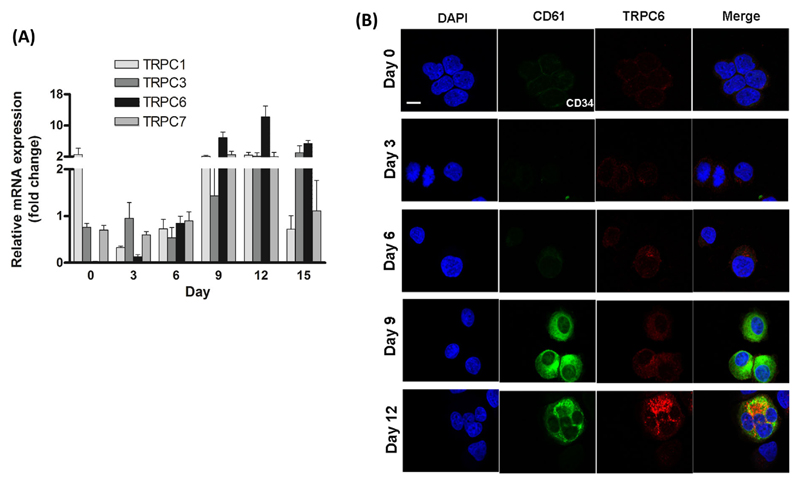
Figure 2. Expression of TRPC6 in developing MKs.
(A) Relative mRNA expression profile of TRPC transcripts on days 0, 3, 6, 9, 12 and 15 as determined by qPCR. Gene expression relative to the housekeeping gene Abelson (Abl) was determined using the comparative Δ Ct method, mean ± SEM, n = 3. (B) Confocal microscopy of TRPC6 protein in human MKs determined on days 0, 3, 6, 9 and 12. Cells were stained with DAPI (blue), CD61 (green) and TRPC6 (red). Scale bar represents 10 μM. Images are representative of four independent cultures.

