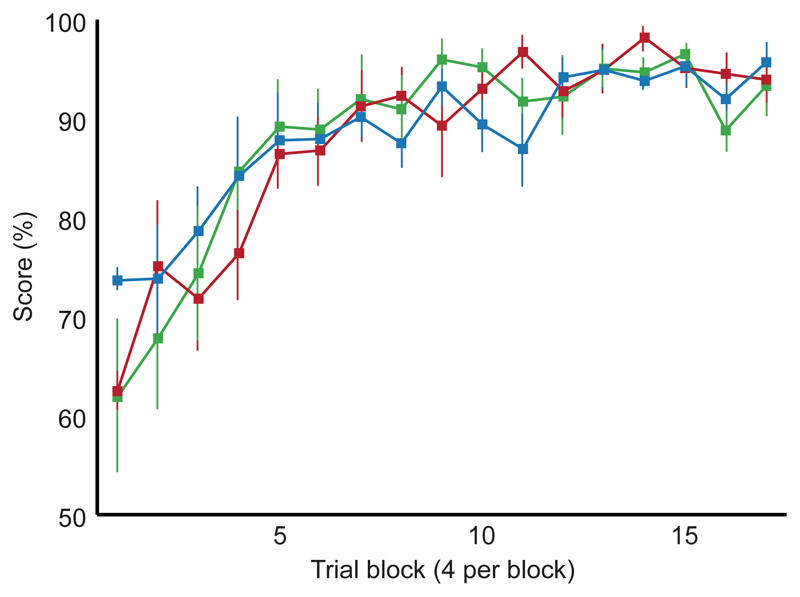
Figure 2. Learning to navigate on the Honeycomb Maze.
Performance of three groups of rats (means ± s.e.m): n = nine unoperated controls (blue), eight operated controls with sham hippocampal lesions (red), and eight operated controls with sham medial entorhinal lesions (green). All animals were tested for 68 to 72 trials over thirteen to seventeen days; data are shown for the first 68 trials. Unoperated controls undertook six trials per day, sham operated controls undertook four per day. Note similarity of performance (F2, 22 < 0.001, p > 0.999, two-way Mixed ANOVA).

