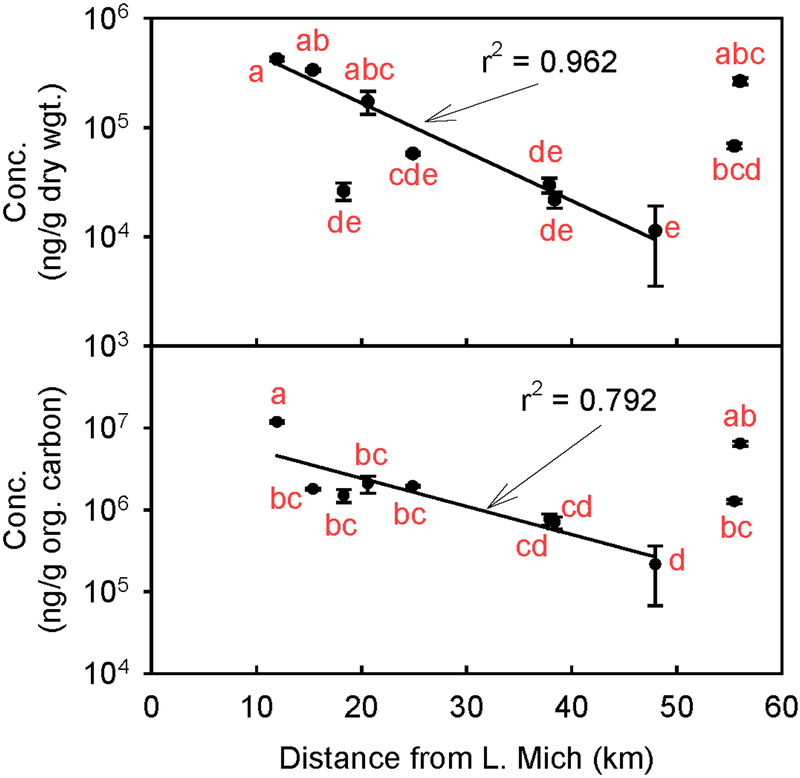
Figure 2:
(Top) Geometric mean concentrations (in ng/g dw) of total PAHs with their corresponding ANOVA results. The line is a regression of the logarithmically transformed concentrations as a function of distance from site 1 to 8, omitting data at site 3; the coefficient of determination is significant at P < 0.01%. (Bottom) Geometric mean concentrations (in ng/g organic carbon) of total PAHs with their corresponding ANOVA results. The line is a regression of the logarithmically transformed concentrations as a function of distance; the coefficient of determination is significant at P = 0.31%. In both cases, the error bars represent standard errors of triplicate measurements, and concentrations sharing the same letter are not significantly different (P < 5%).

