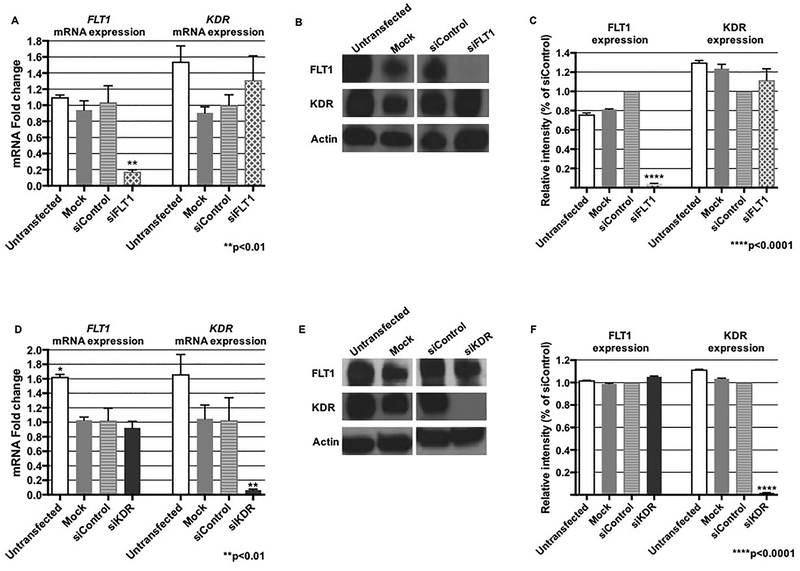
Figure 1. RNA interference of FLT1 or KDR is specific.
(A) Real-time PCR demonstrated more than 80% ablation of FLT1 mRNA expression after transfection with siFLT1 (p<0.01), with no effect on KDR expression. (B and C) A representative western blot with graphical representation also confirmed specificity of FLT1 siRNA (p<0.0001). (D) KDR mRNA expression was decreased by approximately 90% after KDR knock-down (p<0.01), with no effect on FLT1 expression. (E and F) A representative western blot with graphical representation after transfection with KDR siRNA also confirmed ablation of KDR expression with no effect on FLT1 expression (p<0.0001). Mock denotes cells exposed solely to exposure to the lipid.

