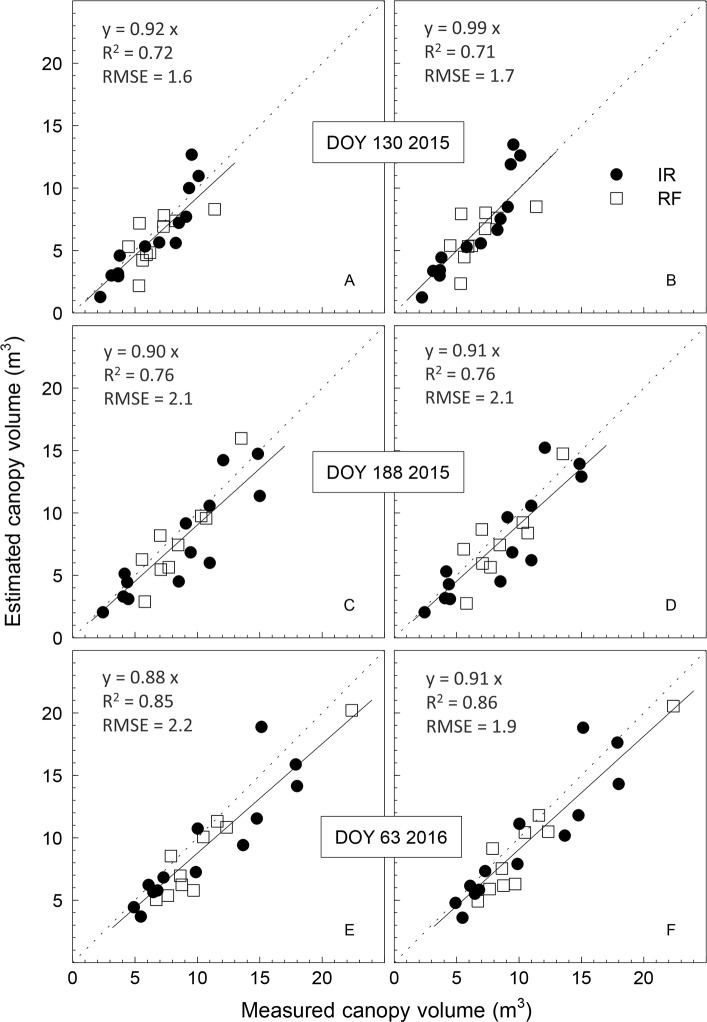
Fig 5.
Comparison between ground measured and UAV-estimated canopy volume of irrigated (IR) or rainfed (RF) olive trees on DOY 130 (A, B) and 188 (C, D) in 2015 and DOY 63 in 2016 (E, F). The UAV-estimated canopy volumes were obtained by considering a distance of the canopy from the ground of 0.7 m (mean value for all trees during the study period) (A, C, E) or by using the distance measured for each tree (B, D, F). The flight altitude was either 70 m (DOY 130 and 188 in 2015) or 50 m (DOY 63 in 2016). No ground control points were used in the flight of DOY 130 in 2015, whereas 20 GCP were positioned in the orchard before the flights of DOY 188 in 2015 and DOY 63 in 2016. Each symbol represents one tree. The solid line is the fitted linear function forced through the origin and the dotted one is the 1:1 line.

