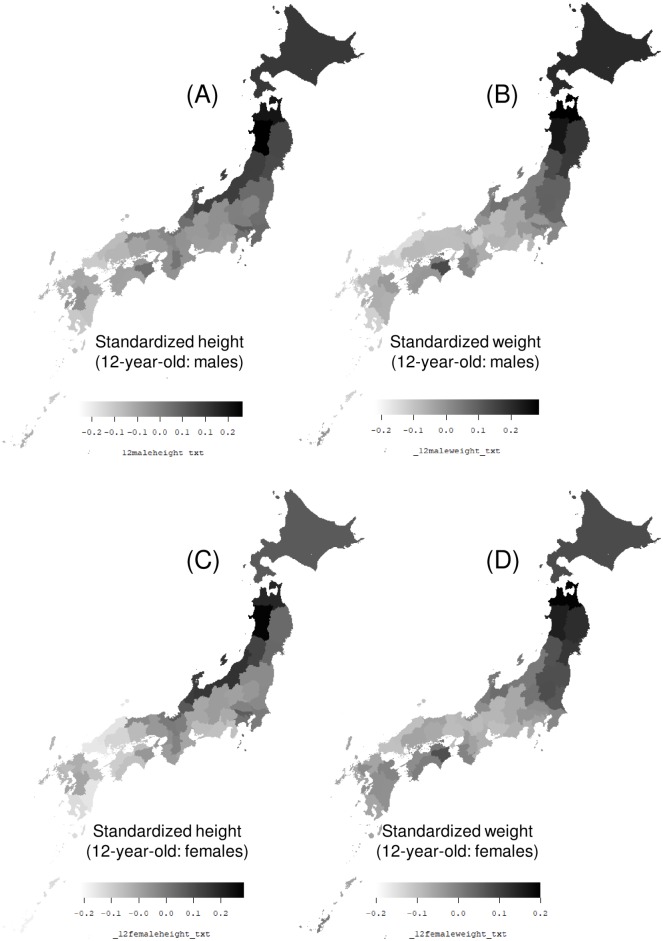
Fig 1. Map of the distribution of standardized heights and weights of Japanese youth.
Map of the distribution of the 25-year (1989 to 2013) average of standardized heights and weights of the following subject groups, in each prefecture: (A) Heights of 12-year-old boys, (B) weights of 12-year-old boys, (C) heights of 12-year-old girls, and (D) weights of 12-year-old girls.

