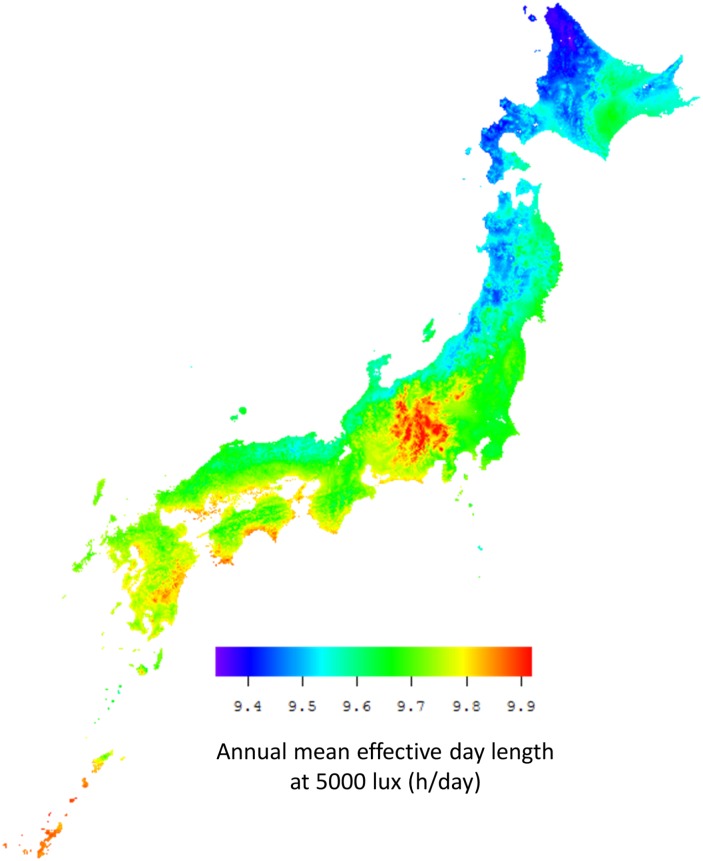
Fig 2. Map of the distribution map of effective day length in Japan.
Mesh Climatic Data 2000 for 380,000 1-km2 mesh areas are shown. The fill color in the mesh areas indicates the annual mean effective day length at 5000 lux (h/day). The latter tend to be relatively low in northern areas along the Sea of Japan.

