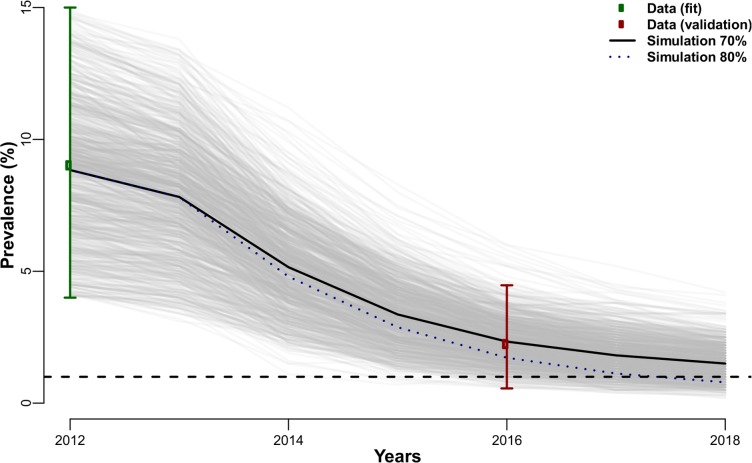
Fig 4. Observed and expected microfilaria prevalence reduction in Agyan province.
Green and red circles represent the 2012 and 2016 prevalence estimates respectively, with their bootstrap confidence interval (green and red lines). The 2012 data were used to fit the model (only simulations in that prevalence range are used), while the 2016 data were used to validate the model (i.e. verify that most simulations fall within the red confidence interval). The grey lines are individual stochastic simulations (500 in total) with a 70% MDA coverage, median value shown as the black.

