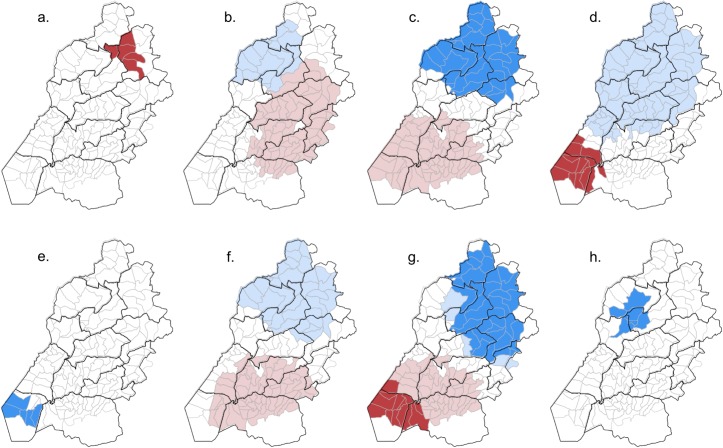
Fig 3.
Clusters of significantly elevated (red) and reduced (blue) sublocation level standardised residual log odds of infection for: a. Hookworm; b. A. lumbricoides; c. T. trichiura; d. S. mansoni; e. E. histolytica/dispar; f. Taenia spp.; g. HIV; h. P. falciparum. Light and dark shades of red and blue represent significant clusters from the null and adjusted logistic regression models, respectively.

