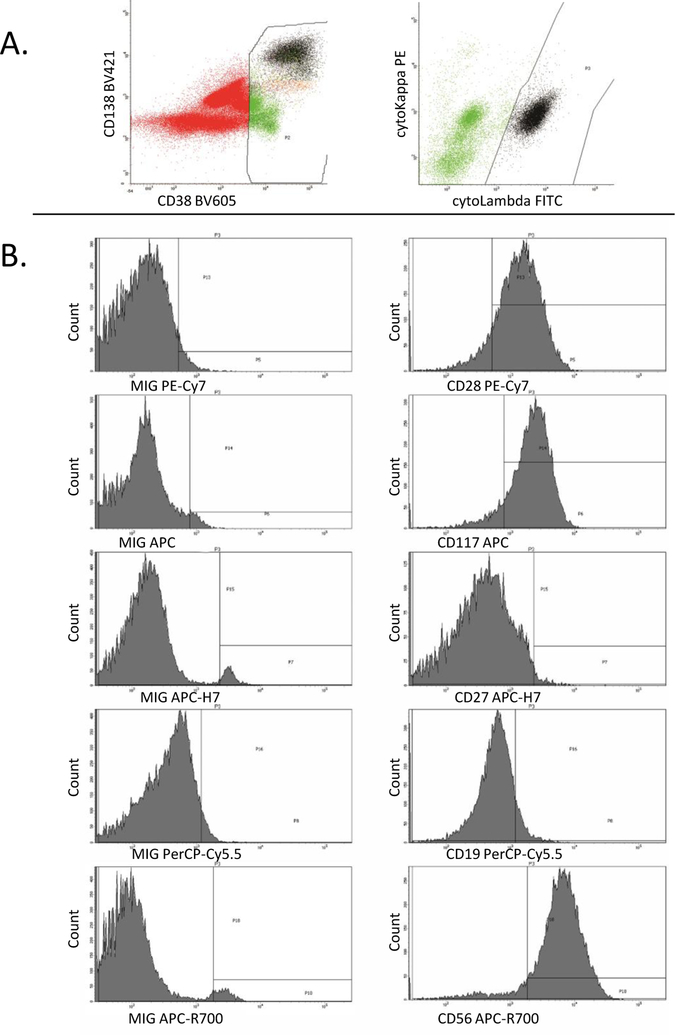
Figure 1:
Example of FACSDiva flow cytometric analysis - bone marrow specimen from a patient with PCM. A. Gating strategy. The cells of interest are identified by bright CD38 expression (left histogram) and cytoplasmic light chain restriction (right histogram). In the MIG (isotype control) tube, cells of interest are identified by bright CD38 expression only. B. Data Analysis. The left column is data from the MIG tube. The right column is data from the antibody-specific tube. The MIG for each fluorochrome is compared to the specific antibody for that fluorochrome. The percentage positive for each of the specific antibodies was identified after setting the MIG control population threshold at 2–4% positive.

