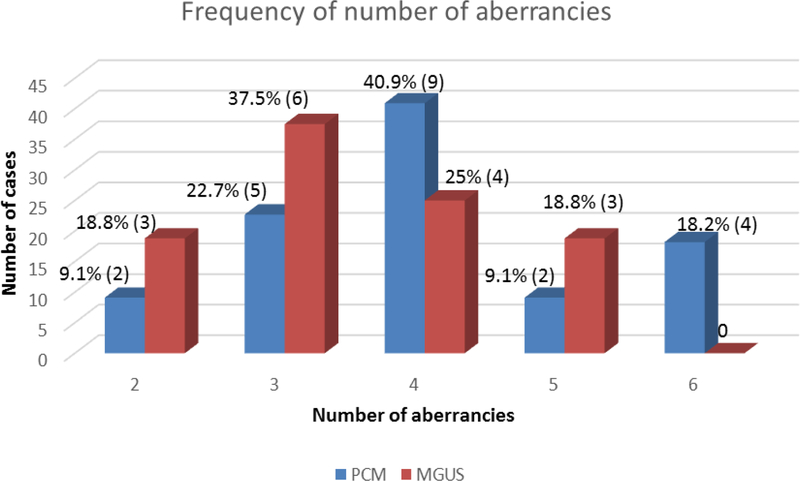
Figure 2:
Frequency of number of antigenic aberrancies in PCM and MGUS groups. The frequency of having a given number of antigenic aberrancies is shown above each bar, both as a percentage of total cases within that group and as number of cases (in parenthesis). There were 22 patients total in the PCM group (blue) and 16 patients total within the MGUS group (red).

