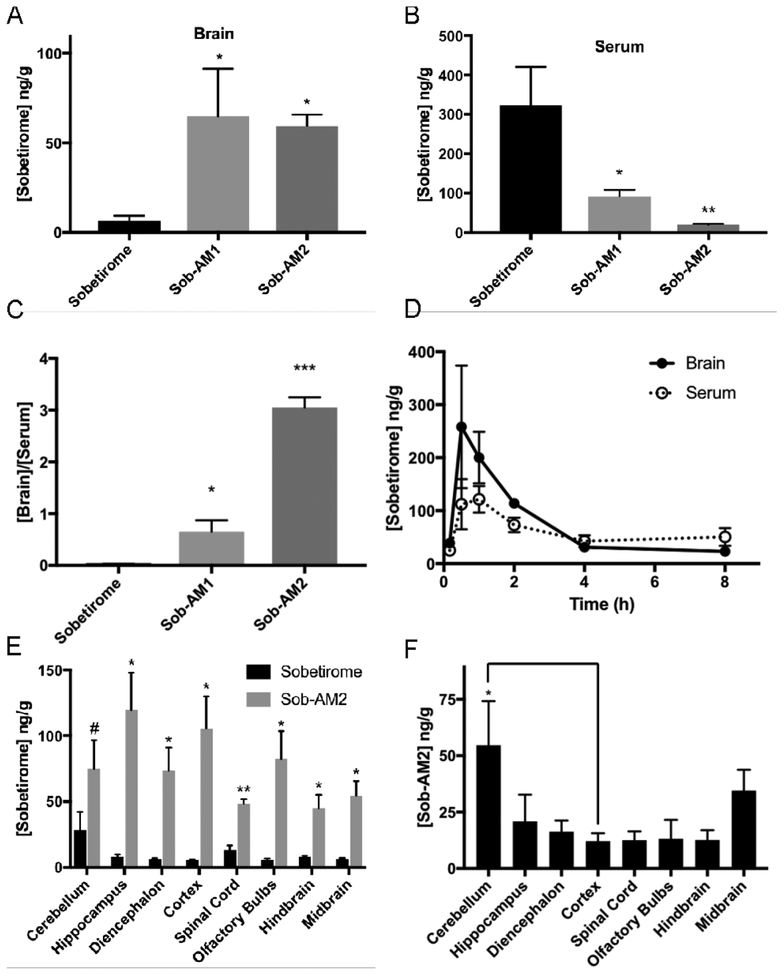
Figure 2. Sobetiramides substantially increase brain exposure while decreasing peripheral concentrations of sobetirome in vivo.
Mouse cohorts (n=6) were treated (i.p., 3.05 μmol/kg) with sobetirome, Sob-AM1, or Sob-AM2. After 1 h, tissues were collected and analyzed by LC-MS/MS for sobetirome levels in the (A) brain and (B) serum. (C) Brain-to-serum concentration ratios at this 1 h time point suggests significant increases in brain selective distribution of the prodrugs. Statistical analyses for A-C were done using one-way ANOVA (Fisher LSD) comparing prodrug values to sobetirome (A-C). To quantify sobetirome exposure from peripherally dosed Sob-AM over time, sobetirome levels the brain and serum (D) was measured from mouse cohorts treated at t=0 (i.v., 9.15 μmol/kg) and measured over 8 h post-dose. Each data point represents n=3. Calculated AUC values are summarized in Table 2. (E) Mice cohorts (n=3) were treated with sobetirome or Sob-AM2 identical to A-C except brain regions were dissected and analyzed separately. Sobetirome concentrations were significantly increased in Sob-AM2 treated mice across almost all CNS regions including the cortex (18-fold) and spinal cord (3.5-fold). Statistical analyses for E were done using multiple two-tailed t-test comparing sobetirome/Sob-AM2 treatments. (F) Sob-AM2 levels were quantified in the same dissected CNS regions as (E) using LC-MS/MS monitoring the Sob-AM2 ion. Intact (non-hydrolyzed) prodrug can be observed across CNS regions at levels similar to the cortex with only the cerebellum displaying significantly elevated Sob-AM2. Statistical analysis for F was done using one-way ANOVA (Fisher LSD) comparing regions to the cortex. All data in A-F represent mean ± SEM and are expressed as a function of tissue weight. (* P= <0.05, ** P <0.01, *** P <0.001)

