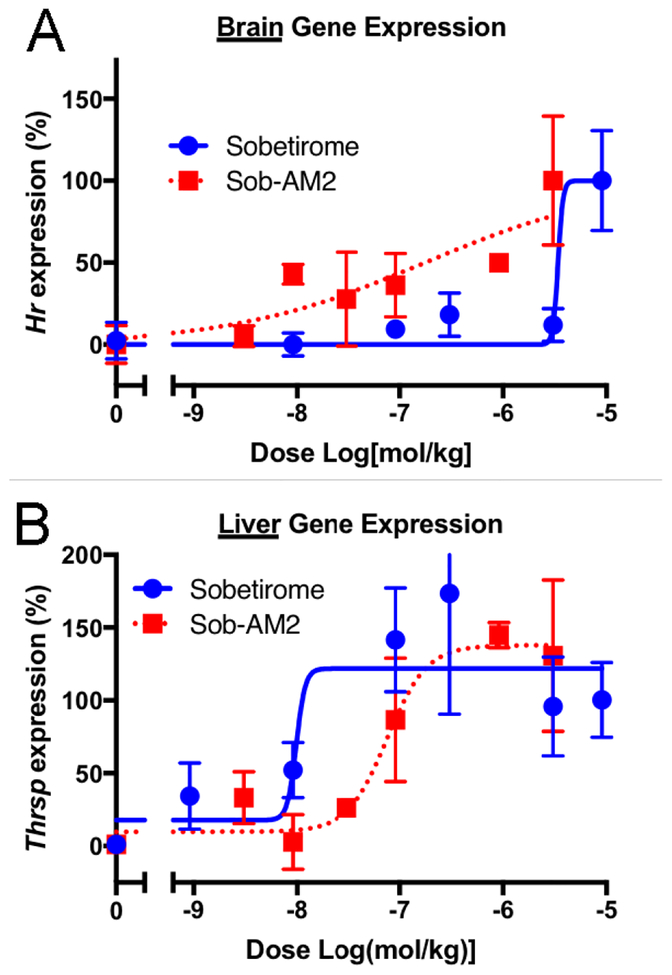
Figure 4. Sob-AM2 is more potent in the brain and less potent in the liver at TR-activation than sobetirome.
Following peripheral dosing (i.p.) of sobetirome or Sob-AM2 in wild type mice across a dose range, transcript levels of the known thyroid-responsive genes Hr and Thrsp were quantified in the brain (A) and liver (B), respectively. In the brain, Sob-AM2 (EC50 ~ 0.17 μmol/kg) was more potent than sobetirome (EC50 ~3.4 μmol/kg). This trend is reversed in the liver with Thrsp response (Sob-AM2 EC50 ~76 nmol/kg; sobetirome EC50 ~10 nmol/kg). Data points represent mean ± SEM and n=3.

