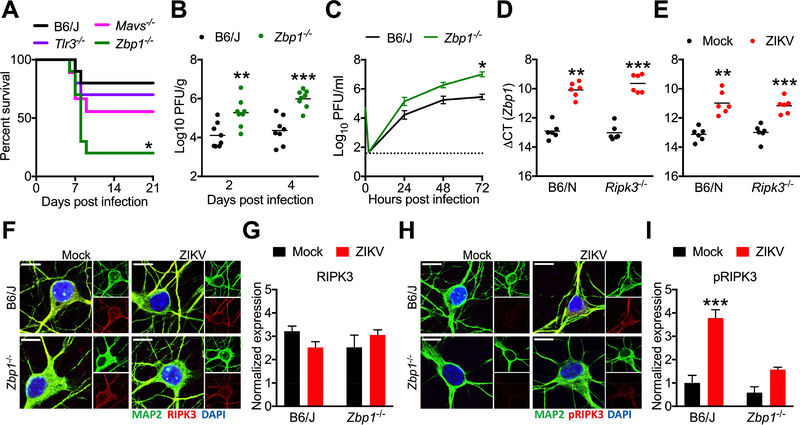
Figure 4: ZBP1 signaling activates RIPK3 and restricts neuronal ZIKV infection.
(A) Survival analysis in Mavs−/−, Tlr3−/−, or Zbp1−/− mice and congenic WT controls following intracranial inoculation with ZIKV-MR766. N= 10 mice/genotype.
(B) Zbp1−/− mice and congenic controls were infected intracranially with ZIKV-MR766. On indicated days following infection, whole brains were assayed for ZIKV titers via plaque assay.
(C) Multistep viral growth curve analysis (MOI 0.1) in primary cortical neurons isolated from Zbp1−/− mice or congenic controls. N= 6 independent replicates.
(D-E) qRT-PCR analysis of Zbp1 mRNA expression in whole brain homogenates 48h following intracranial ZIKV infection (D) or in primary cortical neurons 24h post infection (E).
(F-I) Fluorescent immunocytochemical detection of neuronal marker MAP2 (green) and RIPK3 (red, F) or phosphorylated RIPK3 (red, H) in primary cortical neurons isolated from Zbp1−/− mice or congenic controls, 6h following infection with ZIKV-MR766 (MOI 10.0). Intensity quantifications in G and I represent integrated red pixel intensity values normalized to green pixel area. Nuclei are stained with DAPI (blue). Images are representative of at least 4 high power fields taken for each of 3 independent replicates. Scale bar= 10μm.
*p<0.05, **p<0.01, ***p<0.001. Error bars represent SEM. Dotted lines indicate limits of detection. All data are pooled from two or three independent experiments. See also Figure S3.

