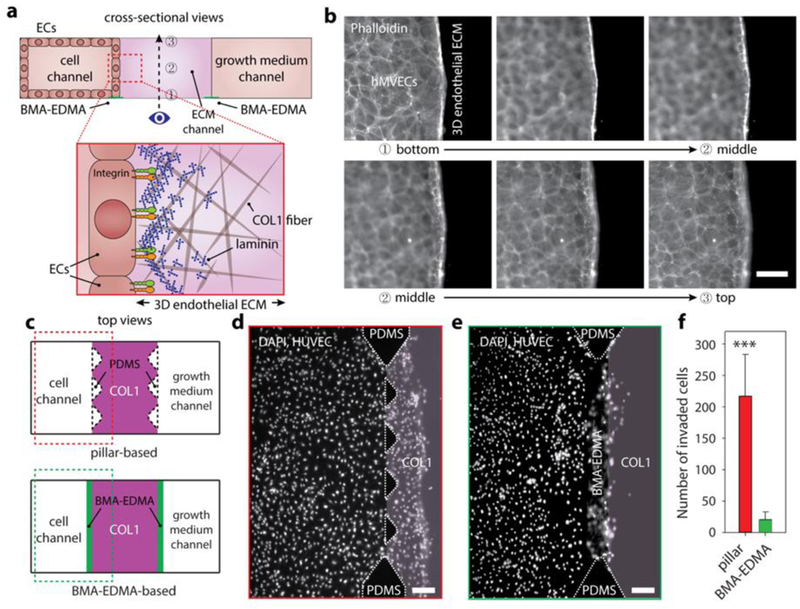
Figure 4. Generation of a quiescent 3D blood capillary model using BMA-EDMA-based hydrogel patterning.

a. Schematic cross-sectional view (not to scale) of the 3D blood capillary model (top). 3D endothelial ECM which consists of COL1 as a 3D constructive ECM and additional thin layer of MAT as a basement membrane (BM) was formed in the ECM channel. Human microvascular endothelial cells (hMVECs) were seeded into the cell channel (left). Bottom illustration depicts a microscopic structural top view of the 3D endothelial ECM (not to scale). Numbers in the top image indicate corresponding focal planes in (b), from bottom (1) to top (3). b. Corresponding fluorescent images of the focal planes shown in (a) of hMVECs cultured (on day4) in the BMA-EDMA device indicate that an hMVEC monolayer was successfully generated without any unwanted angiogenesis/sprouts or migration. Scale bar: 50 µm. c. Schematic top views of pillar-based 3D cell culture assay (top) and our BMA-EDMA-based assay (bottom). The pillar-based assay relies on surface tension generated by sharp edges between each trapezoidal pillar to prevent hydrogel from escaping the ECM area, while our BMA-EDMA-based assay employs an ultra-thin layer of hydrophobic pattern on the glass substrate to generate a sharp change in surface wettability. d. Geometric difference between two assays shown in (c) significantly affected the diffusion profiles of growth factors throughout the cell and ECM channels (see supplementary information for simulated diffusion profiles throughout the channels), resulting in unwanted migration of human umbilical vascular endothelial cells (HUVECs) into the ECM in the pillar-based assay (on day4). Scale bar: 300 µm. e. The larger interface area of the BMA-EDMA-based assay enabled the more efficient supply of growth factors to the cells, which mediated unintended concentration gradient caused by cellular consumption of growth factors relative to the pillar-based assay. Scale bar: 300 µm. f. Quantification of the number of the cells that migrated into the COL1 in the assays shown in (d) and (e). Data are shown as the means ± SD (n = 4). ***p<0.001.
