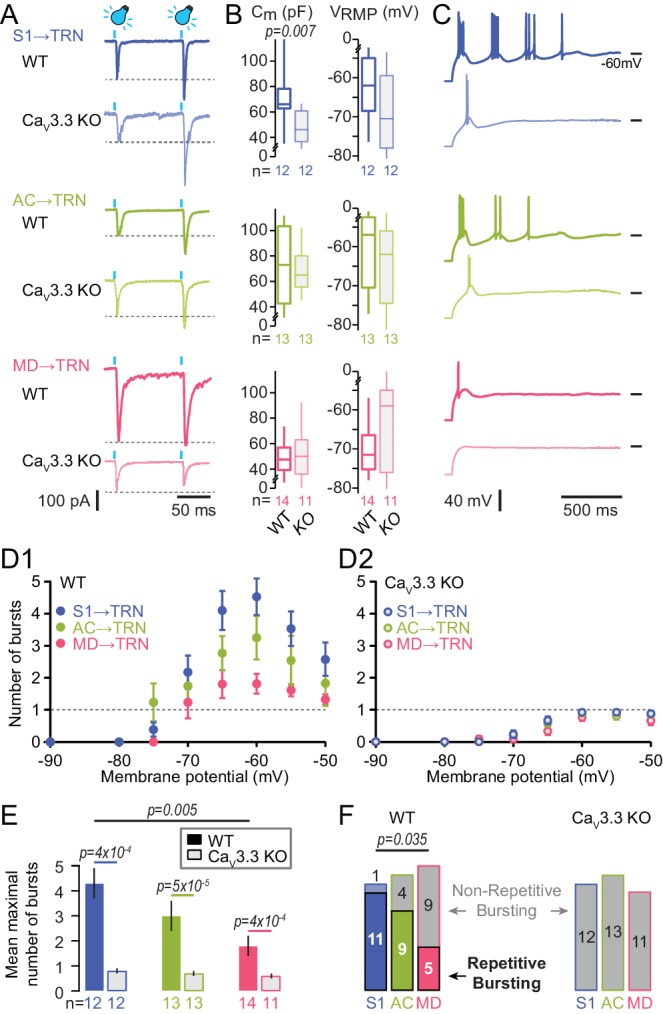
Figure 2. Oscillatory burst firing varies across TRN sectors and depends on CaV3.3 Ca2+ channels.
(A) Representative traces of paired EPSCs in whole-cell voltage-clamped TRN neurons at −60 mV of WT and CaV3.3 KO mice upon light activation of S1 (top), AC (middle) and MD (bottom) afferents. Afferent-specific forms of short-term plasticity are preserved across genotypes (see Results for averaged data). (B) Box-and-whisker-plots of the mean capacitance (Cm) and the resting membrane potential (VRMP) of the recorded TRN neurons (WT: n = 12 for S1, n = 13 for AC, n = 14 for MD; CaV3.3 KO: n = 12 for S1, n = 13 for AC, n = 11 for MD). It can be noted that the Cm of S1-innervated TRN neurons in CaV3.3 KO showed a reduction compared to WT, suggesting smaller cell size (Mann-Whitney test, p=0.007). (C) Representative current-clamp recordings of oscillatory bursting responses of TRN neurons across sectors, induced through hyperpolarizing current injections (−50 to −300 pA for 500 ms). Horizontal lines denote −60 mV. Note the strong repetitive burst firing in sensory sectors that is impaired in the CaV3.3 KO cells, whereas MD-innervated cells mostly discharge a single burst. (D) Graph of the number of repetitive bursts as a function of the membrane potential prior to the hyperpolarizing pulse (Cueni et al., 2008). This yields a U-shaped curve reaching a peak at −65 and −60 mV in all sectors of WT mice (D1) that was abolished in CaV3.3 KO mice (D2). Dashed horizontal lines at ordinate value one indicate the border between repetitive and not-repetitive bursting conditions. (E) Mean number of repetitive bursts of TRN neurons (between −60 and −65 mV) across sectors and genotype. Mann-Whitney tests were used for comparison between genotypes, and p-values are given above the bars. (F) Histogram of the proportion of repetitive (colored rectangles) and non-repetitive bursting (grey rectangles with color surroundings) TRN neurons in the different sectors. Chi-square test followed by pairwise proportion test with Holm’s p-value adjustment was used for statistical evaluation, with significant value given above the bars.

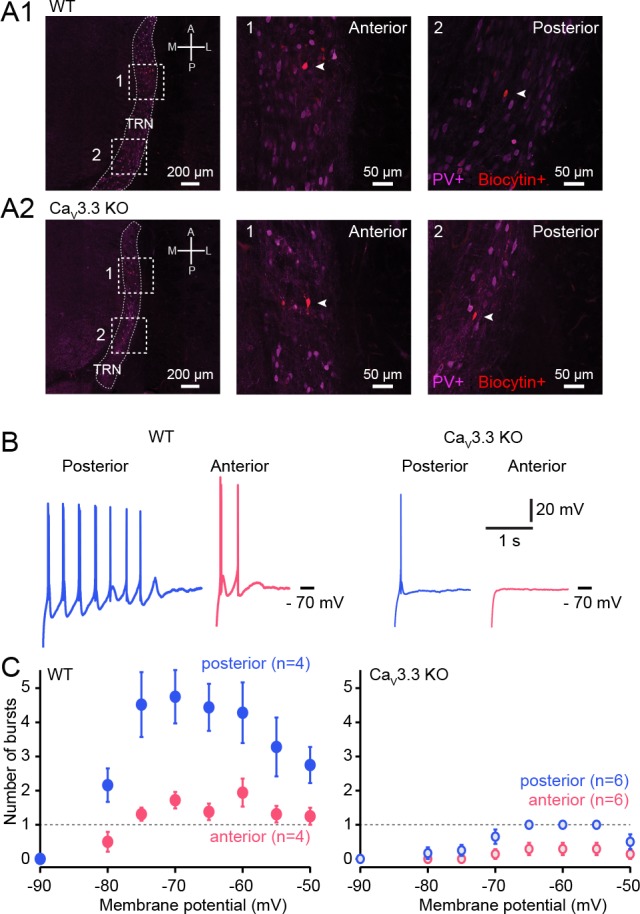
Figure 2—figure supplement 1. Oscillatory burst firing varies across the anteroposterior extent of TRN and depends on CaV3.3 Ca2+ channels.

