. 2019 Jan 22;8:e39298. doi: 10.7554/eLife.39298

Figure 4. Signal intensity distribution in young leaves generated by p35S driven auxin sensor and control.

(A and B) Confocal projections of Arabidopsis seedlings aged 3DAS (days after stratification) showing expression pattern of p35S::DII-VENUS (magenta) (A) and p35S::mutatedDII-VENUS (mDII, magenta) (B). (C and D) Longitudinal reconstructed optical sections of (A and B), respectively, along the dashed lines. (E and F) Representative examples of transverse reconstructed optical sections of 3DAS Arabidopsis seedlings showing DII-VENUS expression (E) and mDII-VENUS expression (F). DII-VENUS is more strongly expressed adaxially indicating low auxin sensing on the adaxial side of the leaves relative to the abaxial side. However, mDII-VENUS also shows high expression on the adaxial side of the leaf (compare E with F) and in the shoot meristem. (G and H) Representative examples of longitudinal reconstructed optical sections of 4DAS Arabidopsis seedlings showing DII-VENUS expression (G) and mDII-VENUS expression (H). At this stage, the DII-VENUS shows a more uniform expression and absence of expression in the vasculature. mDII-VENUS also shows a similar pattern to DII but is also expressed in the vasculature (H). Scale bars 15 μm (A and C) 20 μm B, (D, E–H). Figure Supplements.

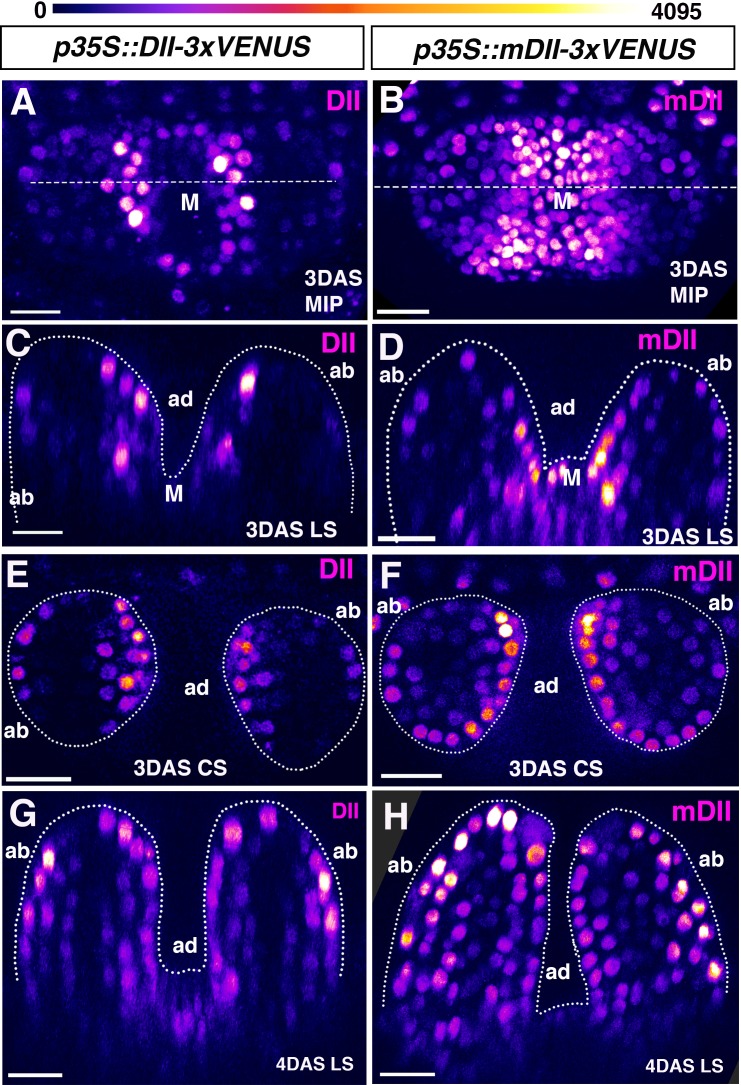
Figure 4.

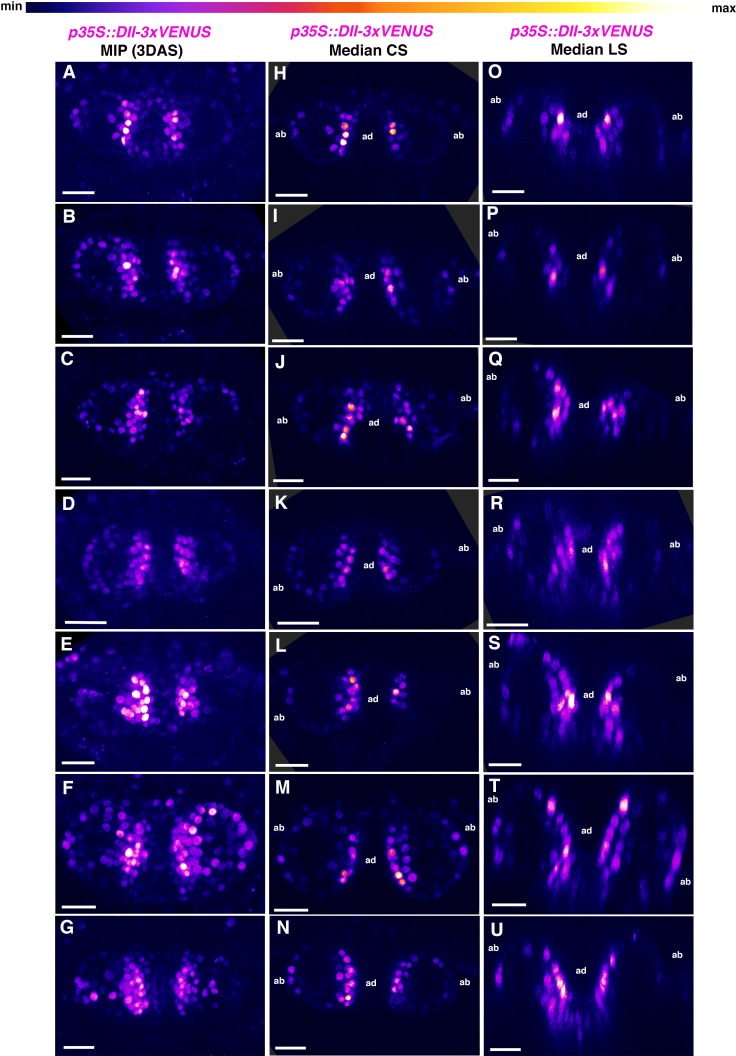
Figure 4—figure supplement 1. Additional examples p35S::DII-3xVENUS-N7 expression in 3DAS old Arabidopsis seedlings.

Figure 4—figure supplement 1.

(A–G) Confocal projections of Arabidopsis seedlings aged 3DAS (days after stratification) showing expression pattern of p35s::DII-3xVENUS-N7 sensor (magenta). (H–N) Median transverse optical sections of (A–G). (O–U) Median longitudinal optical sections of (A–G). Scale bars 20 μm (A–U).

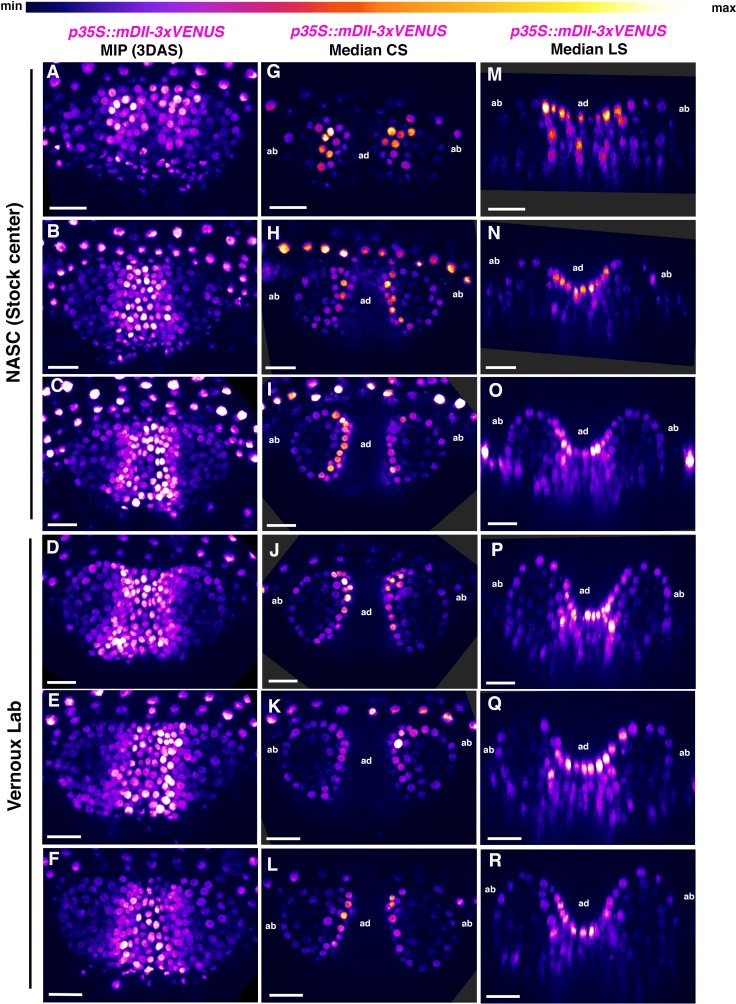
Figure 4—figure supplement 2. Additional examples of p35S::mDII-3xVENUS-N7 expression in 3DAS old Arabidopsis seedlings.

Figure 4—figure supplement 2.

(A–F) Confocal projections of Arabidopsis seedlings aged 3DAS (days after stratification) showing expression pattern of p35S::mDII-3xVENUS-N7 sensor (magenta). Note that plants generated from two different seed sources showed similar expression patterns. (G–L) Median transverse optical sections of (A–F). (M–R) Median longitudinal optical sections of (A–G). Scale bars 20 μm (A–R).

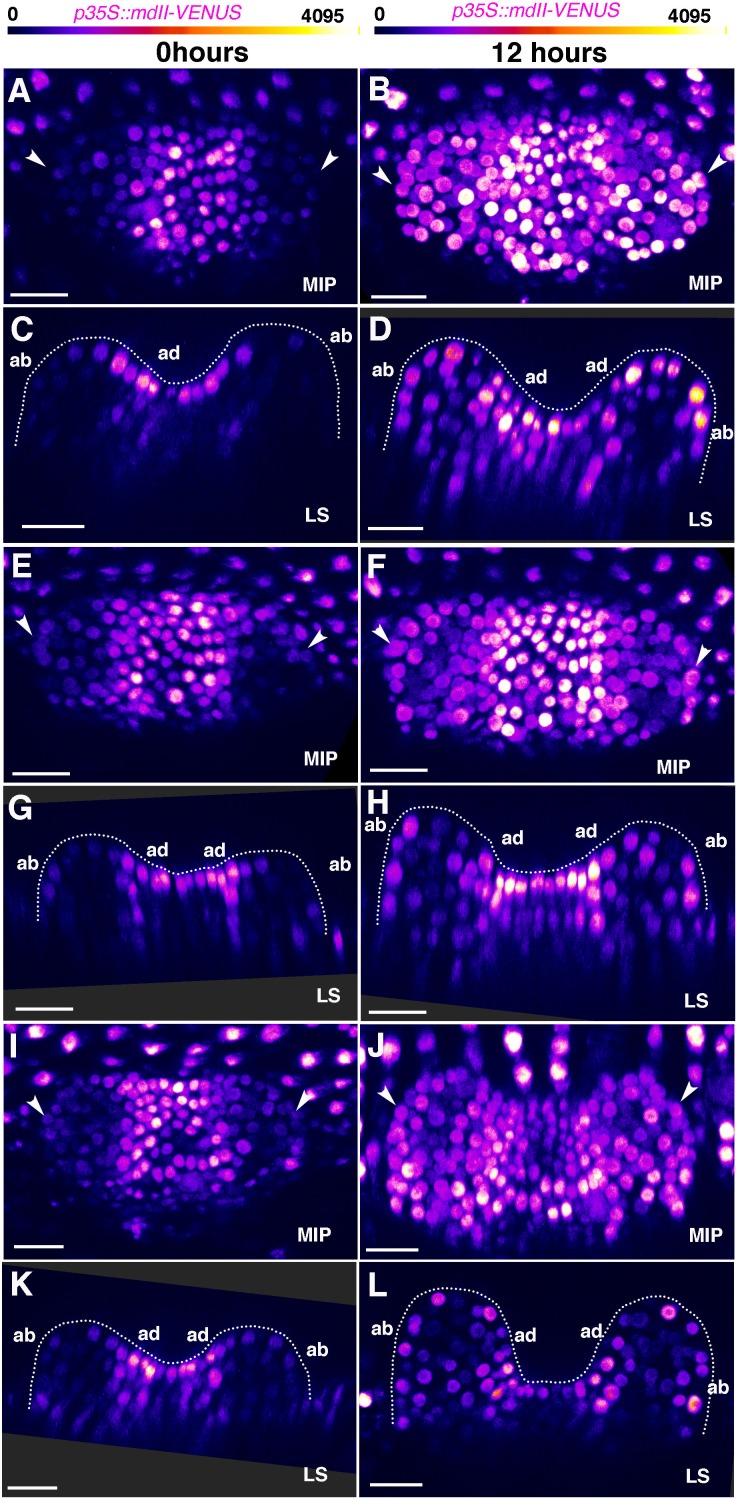
Figure 4—figure supplement 3. Changes in p35S::mDII-V expression in young leaves over 12 hours.

Figure 4—figure supplement 3.

(A, E, I) Confocal projections of seedlings 3DAS showing expression pattern of p35S::mDII-V (magenta) within the first two leaves at 0 hr. (C, G, K) Longitudinal optical sections of (A), (E), (I) respectively. Note relatively weak mDII expression on the abaxial side of the leaves than the adaxial side (also arrowheads in (A), (E), (I)). (B, F, J) Confocal projections of seedlings in (A, E, I) respectively showing expression pattern of p35S::mDII-V (magenta) within the first two leaves at 12 hr. (D, H, L) Longitudinal optical sections of (B), (F), (J) respectively. Note appearance of increased mDII expression on the abaxial side of the leaf compared to 0 hr (also arrowheads in (B), (F), (J). (n = 20/20 leaves, 10 seedlings). Scale bars 20 μm (A–L).

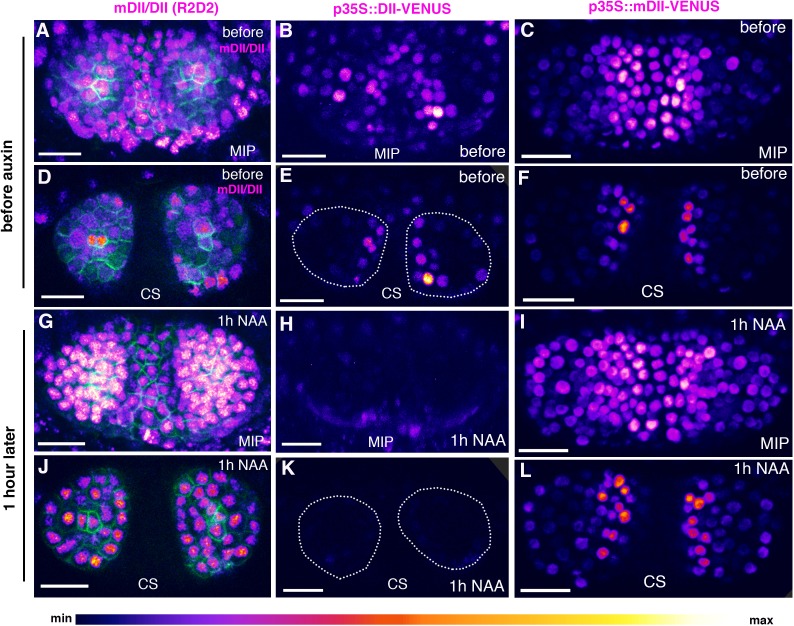
Figure 4—figure supplement 4. Response of different auxin sensors to external auxin application.

Figure 4—figure supplement 4.

(A–F) Confocal projections (A–C) and transverse optical reconstructions (D–F) of Arabidopsis seedlings, 3DAS, showing mDII/DII ratio intensity distributions (magenta) along with PIN1-GFP expression (green) (A,D), DII-VENUS sensor (magenta) (B,E) and mDII-VENUS sensor (magenta) (C, F) within the first two leaves before auxin application. (G–L) Confocal projections (G–I) and transverse optical reconstructions (J–L) of Arabidopsis seedlings, 3DAS, showing mDII/DII ratio intensities (magenta) along with PIN1-GFP expression (green) (G, J), DII-VENUS sensor (magenta) (H, K) and mDII-VENUS sensor (magenta) (I, L) 1 hr after the application of 5 mM NAA. Note, the high mDII/DII ratio intensity indicates an increased and broadening of auxin levels after NAA application (compare D and J) (n = 3/3 seedlings, six leaves). DII-VENUS shows an attenuated expression within 1 hr of auxin application (compare B,E with H,K) (n = 4/4 seedlings, eight leaves). mDII-VENUS levels do not decrease upon auxin application (compare C,F with I,L) (n = 4/4 seedlings, eight leaves). Scale bars 20 μm (A–L).