. 2019 Jan 10;8:e43231. doi: 10.7554/eLife.43231

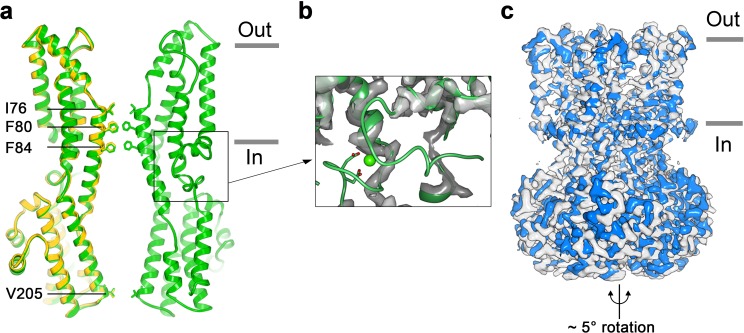
Figure 3. Structure of Ca2+-free BEST1345.

(a) Overlay comparison of the Ca2+-free conformation of BEST1345 (yellow) with the Ca2+-bound closed conformation of BEST1345 (green). One (Ca2+-free) or two (Ca2+-bound) channel subunits in ribbon are shown from the side with the approximate boundaries of the bilayer indicated. The side chains of labeled residues are shown. The boxed area highlights the location of the Ca2+-clasp. (b) Density for the Ca2+-clasp is missing in the absence of Ca2+. The structure of the Ca2+-clasp region from the Ca2+-bound closed conformation (green) is shown in comparison with the cryo-EM density in this region in the Ca2+-free map, showing that the density for the Ca2+ ion and surrounding protein residues are missing in the absence of Ca2+. Ca2+ is depicted as a green sphere and two aspartate residues that coordinate Ca2+ as part of the Ca2+ clasp are shown as sticks. (c) Refined cryo-EM maps of two conformations (blue, gray) of Ca2+-free BEST1345 that were identified using 3D classification. The maps are aligned according to their membrane-spanning regions, with the relative rotation between the cytosolic regions indicated.

Figure 3.

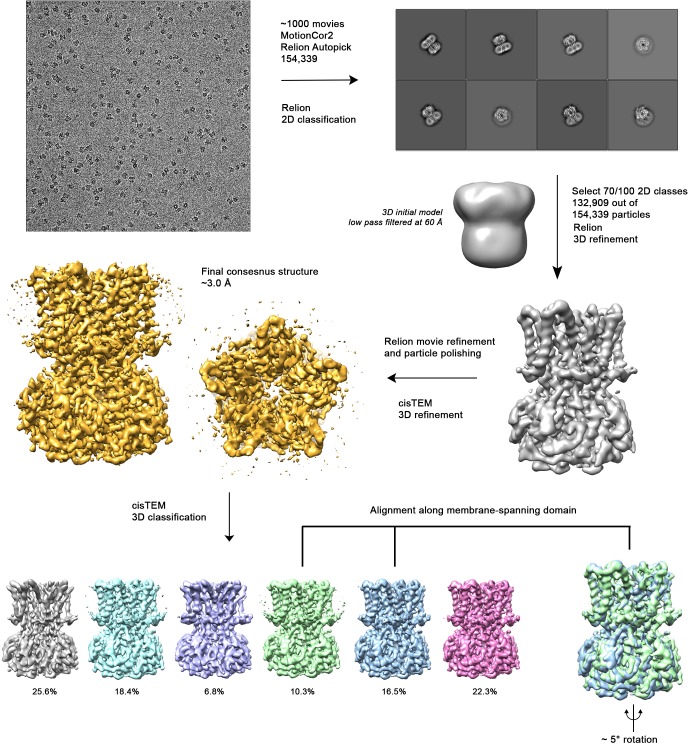
Figure 3—figure supplement 1. Cryo-EM workflow for the BEST1345 Ca2+-free dataset.

Figure 3—figure supplement 1.

A detailed description can be found in Methods.
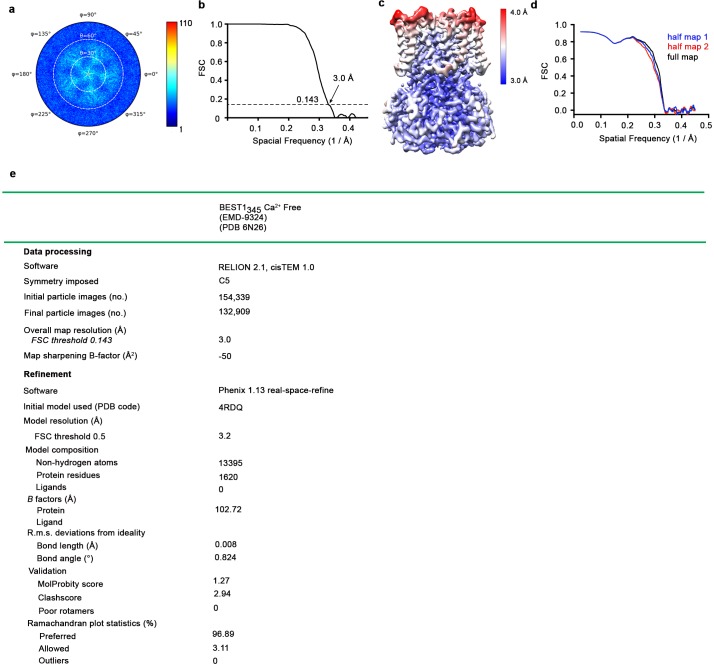
Figure 3—figure supplement 2. Cryo-EM structure determination of: Ca2+-free BEST1345.

Figure 3—figure supplement 2.

(a–d) Structure determination of the consensus Ca2+-free BEST1345 conformation. (a) Angular orientation distribution of particles used in the final reconstruction. The particle distribution is indicated by color shading, with blue to red representing low and high numbers of particles. (b) Gold-standard Fourier shell correlation (FSC) curve of the final 3D reconstruction. The resolution is 3.0 Å at the FSC cutoff of 0.143 (dotted line). A thin vertical line indicates that only special frequencies to 1/ (5 Å) were used to determine particle alignment parameters during refinement. (c) Local resolution of the map estimated using Relion and colored as indicated. (d) Model validation. Comparison of the FSC curves between the model and half map 1 (work), model and half map 2 (free) and model and full map are plotted. (e) Table of data processing and model statistics.
Figure 3—figure supplement 3. Map of Ca2+-free BEST1405.
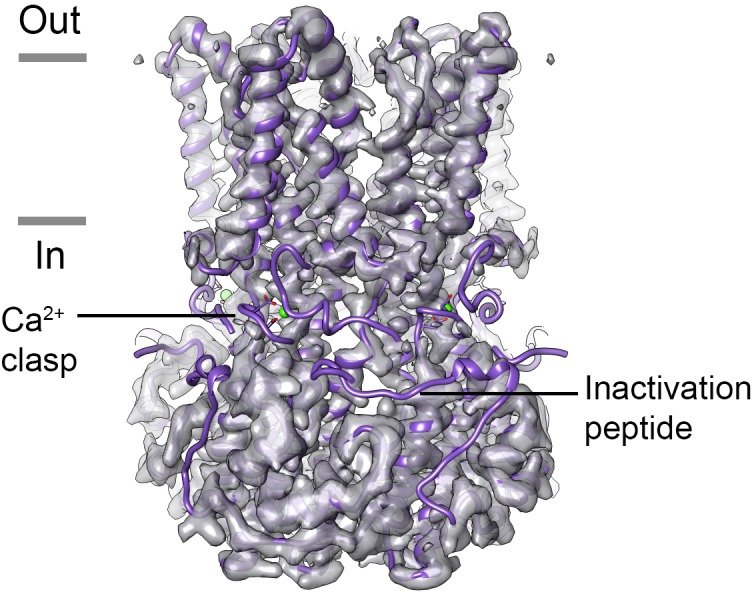
Figure 3—figure supplement 3.

Density for the Ca2+-clasp and the inactivation peptide is missing in the absence of Ca2+ for BEST1405. The X-ray structure of Ca2+-bound BEST1405 (Kane Dickson et al., 2014) is shown as purple ribbons for comparison with the cryo-EM density of Ca2+-free BEST1405. Ca2+ is depicted as a green sphere and a Ca2+ clasp and an inactivation peptide are annotated.