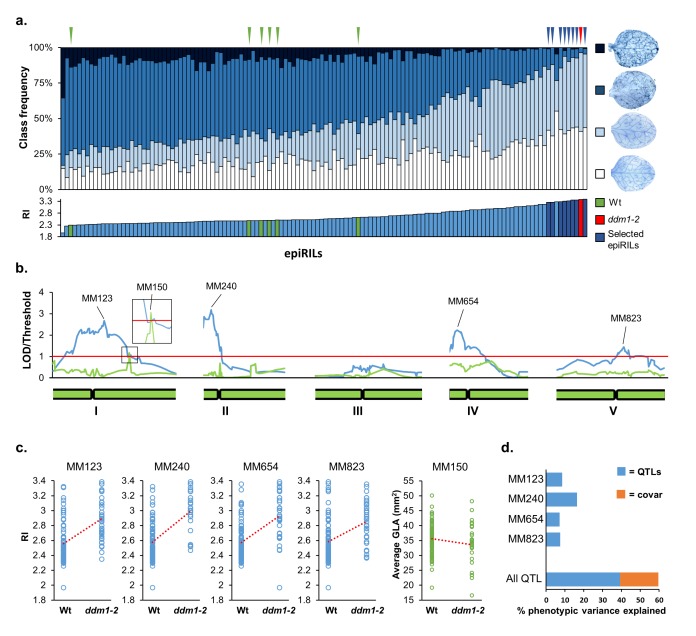
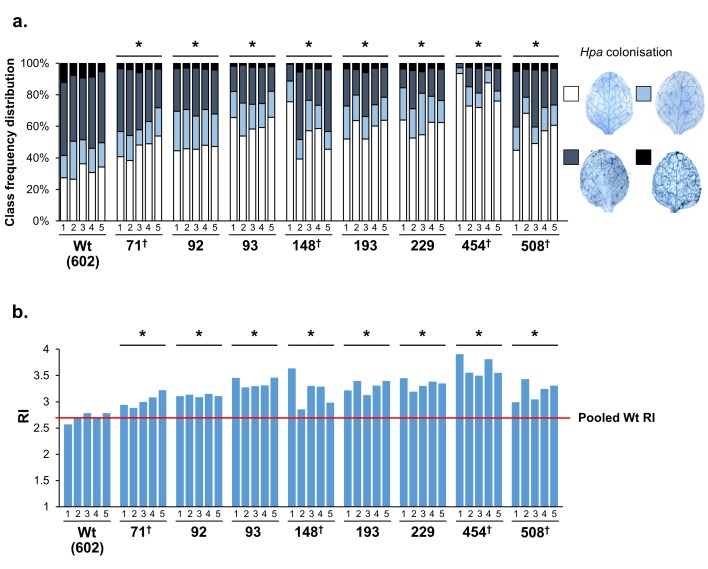
Figure 1. Mapping of epigenetic quantitative trait loci (epiQTL) controlling transgenerational resistance against Hyaloperonosopra arabidopsidis (Hpa).
(a) Levels of Hpa resistance in 123 epiRIL lines, the ddm1-2 line (F4; red triangle) and six Wt lines (Col-0; green triangles). Top graph shows distribution of infection classes in each epiRIL; blue triangles pinpoint the eight most resistant epiRILs with statistically similar levels of Hpa colonisation as the ddm1-2 line (Pearson’s Chi-squared test, p>0.05). Bottom graph shows variation in Hpa resistance index (RI). Green bars: Wt lines; red bar: ddm1-2; blue bars eight most resistant epiRILs (n > 100). (b) Linkage analysis of RI (blue line) and green leaf area (GLA) of three-week-old seedlings (green). Green bars at the bottom represent chromosomes. Red line represents the threshold of significance. Peak DMR markers with the highest LOD scores are shown on top. (c) Correlation plots between peak marker haplotype (methylated Wt versus hypomethylated ddm1-2) and RI (blue) or GLA (green). (d) Percentages of resistance variance explained by the peak DMR markers, including covariance between markers (orange).

