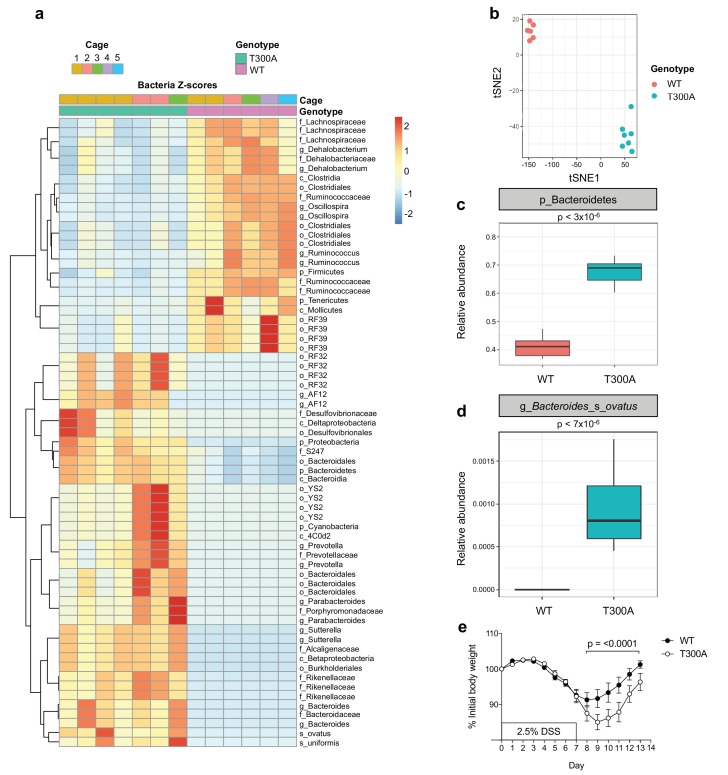
Figure 2. Altered microbiota in conventionally-housed WT vs T300A mice with gut inflammation.
12 week old WT and T300A conventionally-housed SPF mice were treated with 2.5% DSS for 7d followed by 7d of regular drinking water. (a) Population analysis of 16S rRNA gene amplicon sequencing from stool samples from WT vs. T300A mice. (p = phylum, c = class, o = order, f = family, g = genus, s = species) Bacteria Z-scores generated by limma. (b) t-Distributed Stochastic Neighbor Embedding (tSNE) plot analysis of WT vs. T300A stool samples post DSS treatment. (c) Box plot analysis of the phylum Bacteroidetes in WT vs. T300A mice post DSS treatment. (d) Box plot analysis of B. ovatus in WT vs. T300A mice post DSS treatment. (e) Percent initial body weight of WT (n = 12) and T300A (n = 15) mice treated with 2.5% DSS for 7d followed by 7d of regular drinking water. Day 8–13 time points, p = < 0.0001. Two-way ANOVA with Tukey‘s post-hoc test.


