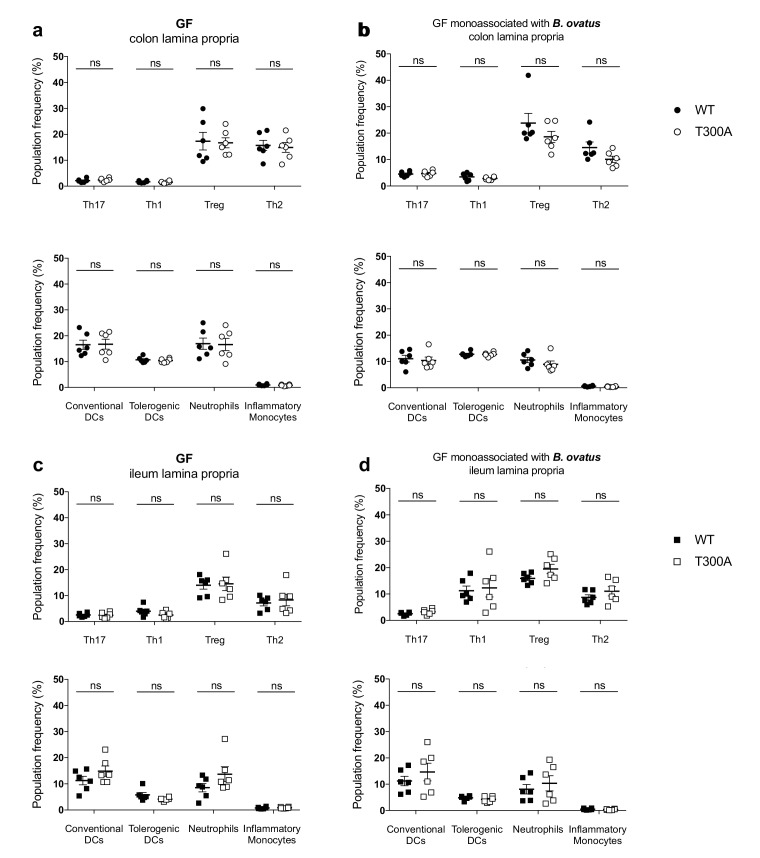
Figure 7. No change in immune cell population frequency in the gut of GF or GF mice monoassociated with B. ovatus 8483.
LP flow cytometry of T and myeloid cell populations from GF mice (WT n = 6, T300A n = 6) or GF mice associated with ~109 CFU of B. ovatus 8483 for three wks (WT n = 6, T300A n = 6). T cell populations are gated as the frequency of RORγt+ (Th17), T-bet+ (Th1), Foxp3+ (Treg) or GATA-3+ (Th2) cells out of CD3+CD4+ cells and myeloid cell populations are gated as the frequency of CD11c+MHCII+ cells out of CD45+ cells (conventional DCs), CD11b-CD103+ cells out of CD11c+MHCII+ cells (tolerogentic DCs), CD11b+GR-1int cells out of CD45+ cells (neutrophils), and CD11b+GR-1hi cells out of CD45+ cells (inflammatory monocytes). CD3+CD4+ and myeloid cell populations were gated on single, live, CD45+ lymphocytes. (a) GF colonic LP T cells (top) and myeloid cells (bottom) (b) GF +B. ovatus 8483 colonic LP T cells (top) and myeloid cells (bottom). (c) GF ileal LP T cells (top) and myeloid cells (bottom) (d) GF +B. ovatus 8483 ileal LP T cells (top) and myeloid cells (bottom). Data are plotted as the mean ± SEM. ns = not significant. Mann-Whitney U test.

