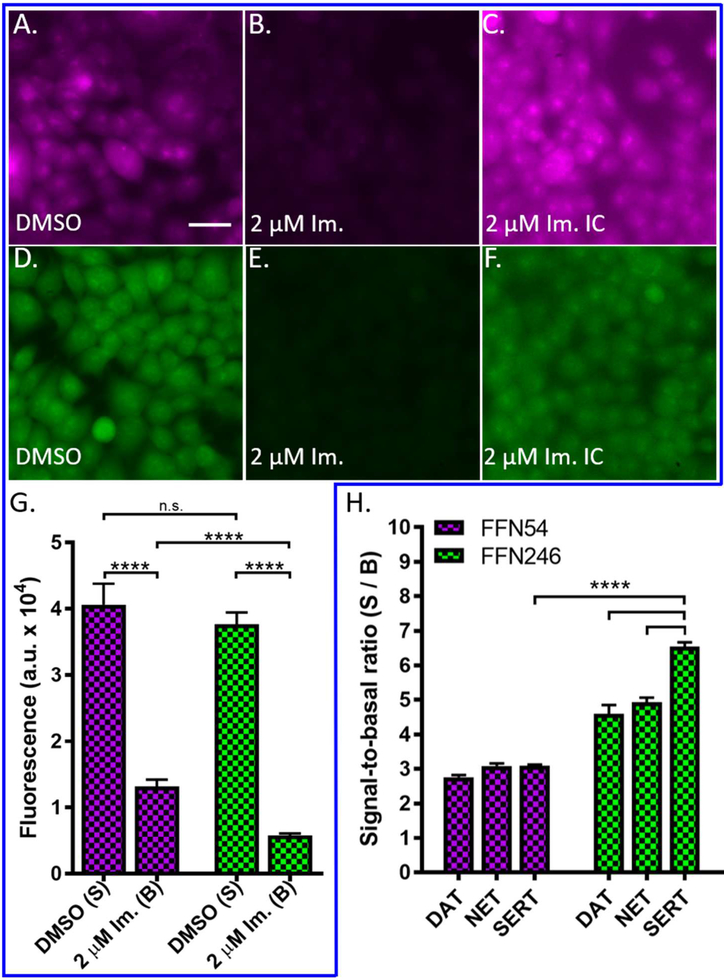
Figure 3.
Probes FFN54 and FFN246 display different levels of background labeling and transporter selectivity. G) Quantification of fluorescence uptake of FFN probes in HEK cells expressing hSERT in the presence and absence of 2 μM imipramine as measured by epifluorescence. Uninhibited cellular uptake of both FFN54 and FFN246 were comparable, reflected in representative images A and D, respectively. The signal of FFN54 and FFN246, when measured in the presence of inhibitor, was significantly decreased for both probes (FFN54 and FFN246: p < 0.0001, n = 6), as observed in representative images B and E, respectively. However, FFN246 has a 58% lower level of non-specific uptake when compared to FFN54 (F, p < 0.0001, n = 6), highlighted in representative images C and F. Scale bar, 30 μm. H) Signal-to-basal ratio (S/B) of FFN54 and FFN246 uptake at hDAT-EM4, hNET-HEK, and hSERT-HEK cells after incubation with the compound (5 μM, plate-reader assay) and inhibition with either nomifensine (2 μM, hDAT-EM4 and hNET-HEK) or imipramine (2 μM, hSERT-HEK). FFN246 exhibited a 2.1-fold increase in S/B over FFN54 in HEK cells expressing hSERT (p < 0.0001, n = 6) FFN246 shows 30% and 40% increased uptake at SERT compared to NET and DAT, respectively (p < 0.0001).

