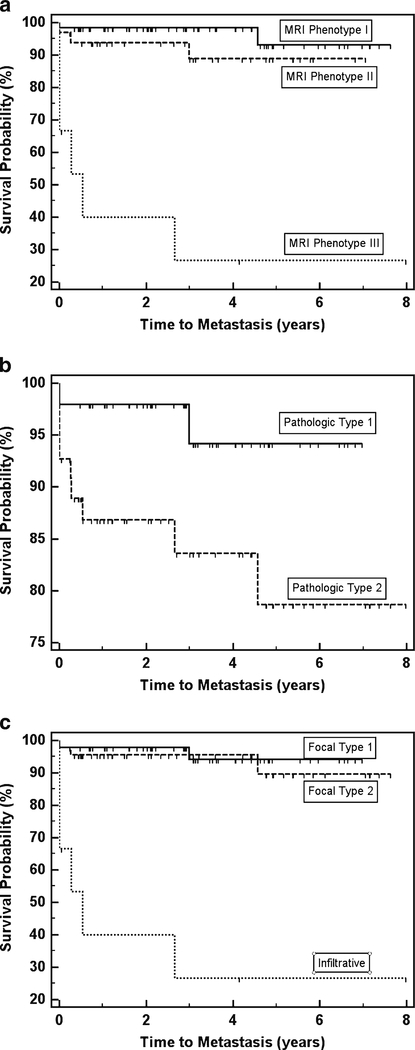
Fig. 4.
Kaplan–Meier progression-free survival (PFS) curves among patients with each MRI appearance (a), each pathological type (b) and overall type (c). Censored survival times are indicated by hash marks. MRI appearance III and overall type ‘infiltrative’ included the same patients and their estimated PFS was 0.534 years. A log-rank test showed significantly worse PFS among patients with pathological type 2 compared with pathological type 1 (P=0.043). There was no significant difference in PFS between MRI appearances I and II (P=0.179) or between focal types 1 and 2 (P=0.633). However, PFS was significantly worse (P<0.001) for MRI appearance III (equivalent to overall ‘infiltrative’ type) than for the other categories combined

