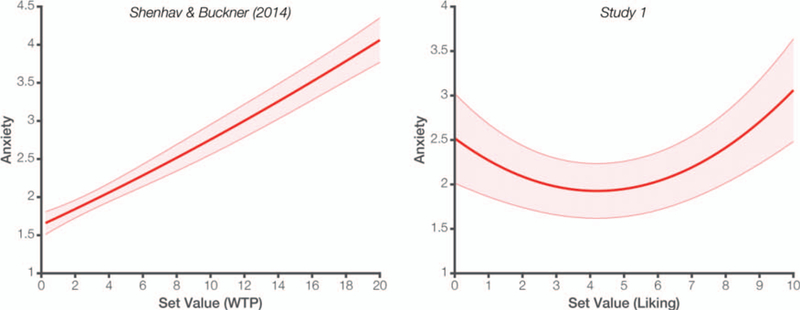
Figure 2.

Left: In Shenhav and Buckner (2014), item values were determined by a WTP procedure and $0.00 items were excluded. Anxiety was primarily a linear function of average set value (online supplemental Table S1). Right: In Study 1, item values were determined by liking ratings and no items were excluded (see also Figure 3). Anxiety instead only exhibited a quadratic relationship with set value. Unless otherwise noted, plots reflect parameter fits based on trial-wise mixed-effects regressions. Shaded error bars reflect standard error of the mean (SEM). See the online article for the color version of this figure.
