
Figure 3.
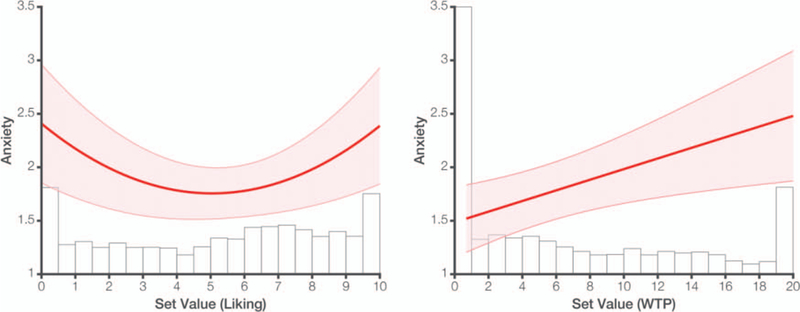
In Study 2, we again observe a quadratic relationship between anxiety and set value (left) but this becomes a positive linear relationship when we exclude choice sets that include a zero-valued bid (based on a follow-up item WTP rating; right). Projected anxiety ratings are overlaid on histograms of item ratings based on the two rating procedures, demonstrating a pronounced peak at $0.00 for the WTP procedure. Shaded error bars reflect SEM. See the online article for the color version of this figure.