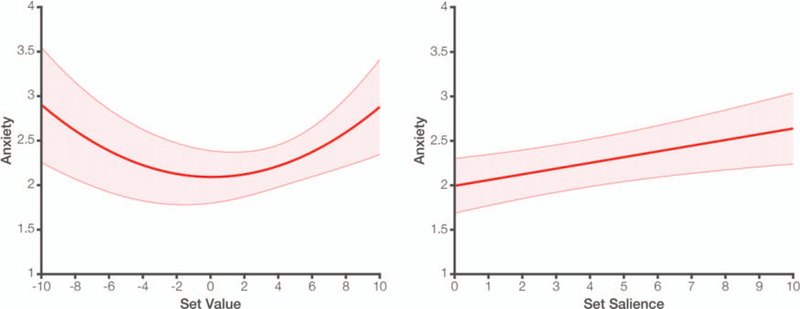
Figure 4.

Left: In Study 3, we again observe a quadratic relationship between set value and anxiety, but in this case a bipolar rating scale was used (−10 to 10) and we see that anxiety is minimal around the zero point. Right: Anxiety increases linearly with the distance between a given set value from the fixed zero midpoint on the rating scale. Shaded error bars reflect SEM. See the online article for the color version of this figure.
