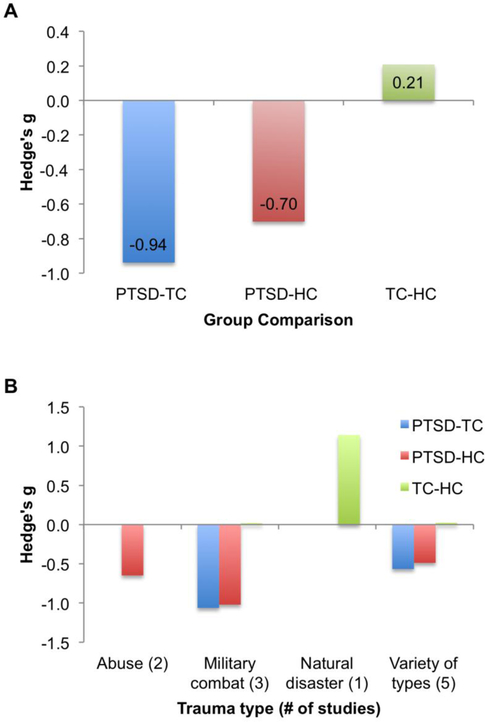
Figure 1.
Summary of effect sizes for group differences in performance on social cognitive tasks, comparing PTSD, trauma-exposed control (TC), and healthy control (HC) groups. Panel A shows the summary across all studies, and Panel B shows the effect sizes broken down by type of trauma exposure for the populations examined in each study. Because only a few studies examined specific trauma types, the results of Panel B are illustrative only, and a statistical comparison of these groups was not performed.

