
Figure 2. Metabolic enrichments in IBD versus control phenotypes.
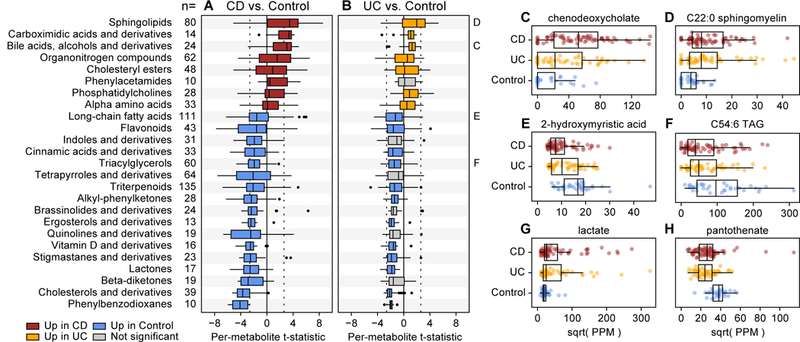
We applied Wilcoxon rank-sum tests to metabolites’ individual differential abundance trends (t-statistics from the linear models) to identify classes of molecules that were broadly enriched in IBD. Focusing on classes of molecules with at least 10 putative members (see the “n=“ column), (A) eight were significantly (FDR q<0.05) positively enriched in CD, meaning that their members tended to be more abundant in CD, and 17 classes were significantly negatively enriched, meaning that their members tended to be more abundant in controls (nominal p-values were two-tailed). (B) A subset of these trends were similarly significant in comparisons between UC and controls, with the remainder (gray) tending to trend in the same direction as CD vs. control comparisons. The dotted line indicates the significance threshold for an individual metabolic feature [abs(t)>2.61]. Panels C through H highlight examples of individually differentially abundant standards measured across 68 CD, 53 UC, and 34 non-IBD control subjects. Metabolites highlighted in panels C, D, E, and F are representatives of broader classes analyzed in A and B. Abundances are in units of parts per million (PPM) after separately sum-normalizing within each LC-MS method; values are square-root scaled for visualization. Boxplot “boxes” indicate the first, second, and third quartiles of the data. Boxplot “whiskers” indicate the inner fences of the data, with points outside the inner fences plotted as outliers.