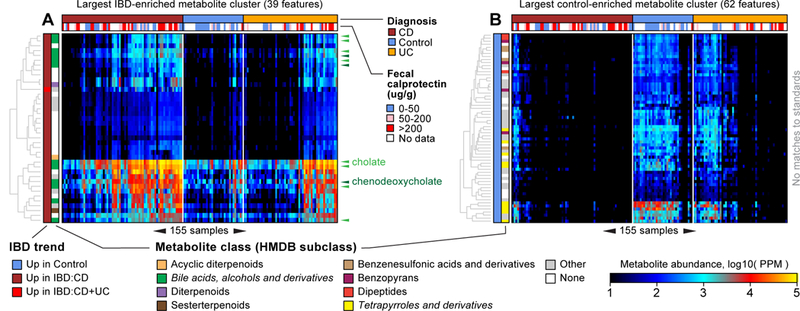
Figure 3. Clusters of chemically related, IBD-perturbed metabolites revealed by abundance covariation.

We clustered differentially abundant (DA) metabolites after regressing out the effects of diagnosis, subject age, and medication use (Methods). A small number of (large) clusters explained many of the DA metabolites. (A) The second-largest cluster contained 39 metabolite features, all of them significantly elevated among CD patients (and one in UC patients as well). This cluster was enriched for putative bile acids and derivatives. Multiple variants of the standards cholate (light green triangles) and chenodeoxycholate (dark green triangles) occur in this cluster. (B) The largest cluster contained 62 metabolite features, all of them significantly elevated in non-IBD controls. This cluster was enriched for putative tetrapyrroles and derivatives. The 155 samples (columns) are ordered the same way in both panels according to Bray-Curtis similarity (and phenotype) of overall metabolic profile (as established in Supplementary Fig. 1). Note the control-like versus CD-like substructure among UC subjects.
