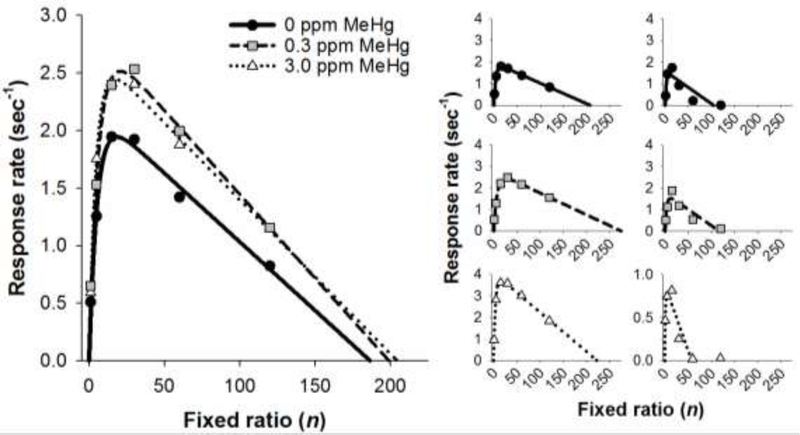
Figure 3.

Left panel: Mean response rate as a function of fixed ratio for mice exposed to MeHg in adolescence. Lines represent mean predictions of Eq. 1. Right panel: Response rate (symbols) and predictions of Eq. 1 (lines) as a function of fixed ratio for individual mice. The left column shows data from mice with the best-fitting curves, and the right column shows data from mice with the worst-fitting curves. Note the Y-axis scaling in the lower-right panel. MeHg = methylmercury
