
Figure 2. Enrichment of dynamic microtubule plus-ends at presynaptic sites specifies SVP delivery and retention.
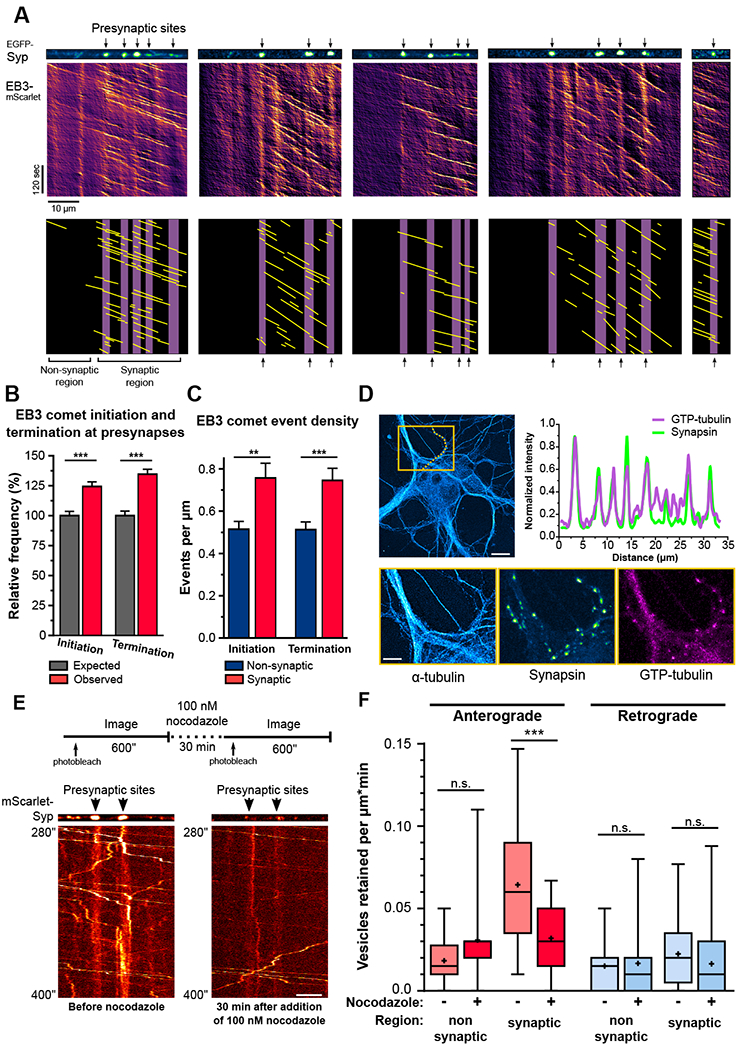
A) Microtubule dynamics on five different axonal sections co-expressing EGFP-Syp and EB3-mScarlet. Lower panels are the annotated kymographs with purple bars representing the presynaptic area and the yellow lines the trajectories of EB3 comets. B) Relative frequency of EB3 comet initiation and termination events within 1μm of presynapse centroids. (n=3211 EB3 initiation events, 3169 EB3 termination events, and 554 presynaptic sites observed in 57 axons from 5 independent cultures; average±SEM spacing between presynapses=14.1±1.4μm; average±SD; ***p<0.0001; one-way ANOVA with Sidak’s post-hoc test. C) Density of EB3 initiation and termination events in synaptic and non-synaptic regions (n=57 axons from 5 independent cultures; average±SEM; **p<0.01, ***p<0.001; Mann-Whitney U test). D) Enrichment of GTP-tubulin at presynaptic sites.. Upper panels: orange box represents inset area; line scan (orange dotted line) shows the synapsin and GTP-tubulin intensity plots along a synaptically connected axon. Lower panels: insets of the α-tubulin, synapsin, and GTP-tubulin channels. E) Experimental design for imaging SVP delivery in the same axonal section before and after nocodazole addition and representative kymographs. F) SVP retention before and after 30 min of 100nM nocodazole treatment (n=25 synaptic and 12 non-synaptic regions from 7 axons from 3 independent cultures; n.s., not significant, ***p<0.001; two-way ANOVA with Sidak’s post-hoc test). See also Figure S4.