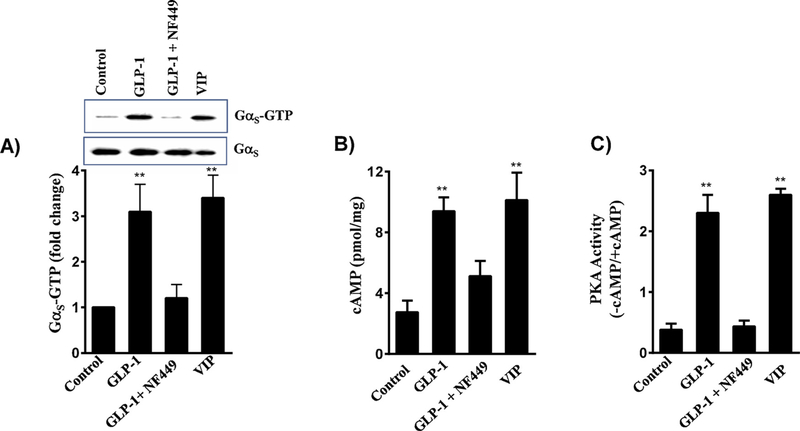
Fig. 2.
Stimulation of Gαs/cAMP/PKA activity by GLP-1(7–36) amide in smooth muscle cells. A) Colonic smooth muscle cells in culture were treated with 1 μM GLP-1(7–36) amide in the presence or absence of Gαs inhibitor, NF449 (10 μM) for 5 min. In some experiments, cells were treated with 1 μM of VIP. Activation of Gαs was measured in a Western blot analysis using an antibody selective for GTP-bound Gαs. The density of bands was calculated by image analysis. A representative image of 3 separate experiments is shown in the figure. ** significant (p < 0.01) stimulation in Gαs activity compared to control. B) Colonic smooth muscle cells in culture were treated with 1 μM GLP-1(7–36) amide in the presence or absence of 10 μM NF449. In some experiments cells were treated with 1 μM VIP. cAMP was measured by ELISA as described in the Methods. Results are expressed as pmol of cAMP/mg protein. Values are mean ± SEM of 4 separate experiments. ** significant (p < 0.01) increase in cAMP levels compared to control. C) Colonic smooth muscle cells in culture were treated with GLP-1(7–36) amide in the presence or absence of 10 μM NF449. In some experiments cells were treated with 1 μM VIP. PKA activity was measured in the lysates using kemptide and [32P]ATP in the presence or absence of cAMP as described in the Methods. Results are expressed as the ratio of PKA activity in counts per minute in the absence or presence of cAMP (-cAMP/+cAMP). Values are mean ± SEM of 4 separate experiments. **significant (p < 0.01) stimulation of PKA activity compared to control.

